AI 数字业务专家
一套集成人工智能数据分析与决策支持的数字化专家系统
我是一名资深财务分析师,曾就职于多家互联网大厂,擅长财务报表分析、预算管理、成本控制和投融资分析。我拥有丰富的实践经验,能够提供精准的财务分析和决策支持,助力企业实现经营目标和可持续发展。
我是一名资深供应链管理者,拥有丰富的新能源汽车行业经验,专注于数据分析领域。在多家知名大厂担任关键角色期间,我通过精准的数据分析,优化供应商管理、采购流程、库存控制和物流效率。利用数据驱动决策,识别供应链中的潜在问题和优化机会,确保供应链的高效运转和持续稳定。我致力于通过数据分析和精细化管理,为企业创造价值,推动新能源汽车行业的发展。
Xpert Cloud 自然语言驱动的BI分析
对话BI
数据洞察&智能分析
ChatBI 将大语言模型对话功能与商业智能(BI)分析能力相结合,通过自然语言交互的方式,为用户提供更加直观和便捷的数据分析体验。
主要功能
多轮对话: 支持多轮对话功能,允许用户进行连续的、上下文相关的交互。系统能够记住前面的对话内容,使数据分析更加深入和精准.
大语言模型: 集成了多种主流大语言模型,如 ChatGPT 和 Llama,提升了自然语言理解和生成的准确性,满足不同业务需求和语言支持.
安全与权限管理: 提供严格的数据安全和权限管理,确保敏感数据的保护.
Xpert Cloud 联合多个模型和数据源.
故事很棒.
用大数据讲故事
通过确定你想要表达的关键点并以逻辑和连贯的方式组织它们,制作你的故事。这可能包括突出特定的数据点,创建图表和图形以说明趋势,并使用示例和案例研究使故事生动。考虑你的老板的角度和优先级,并将你的故事量身定制以与他们的目标和兴趣保持一致。
在工作区设计故事
数据可视化:创建图表、表格、地图和其他形式的数据表示.
故事讲述:支持创建吸引人的数据故事,以传达见解并影响决策.
计算度量
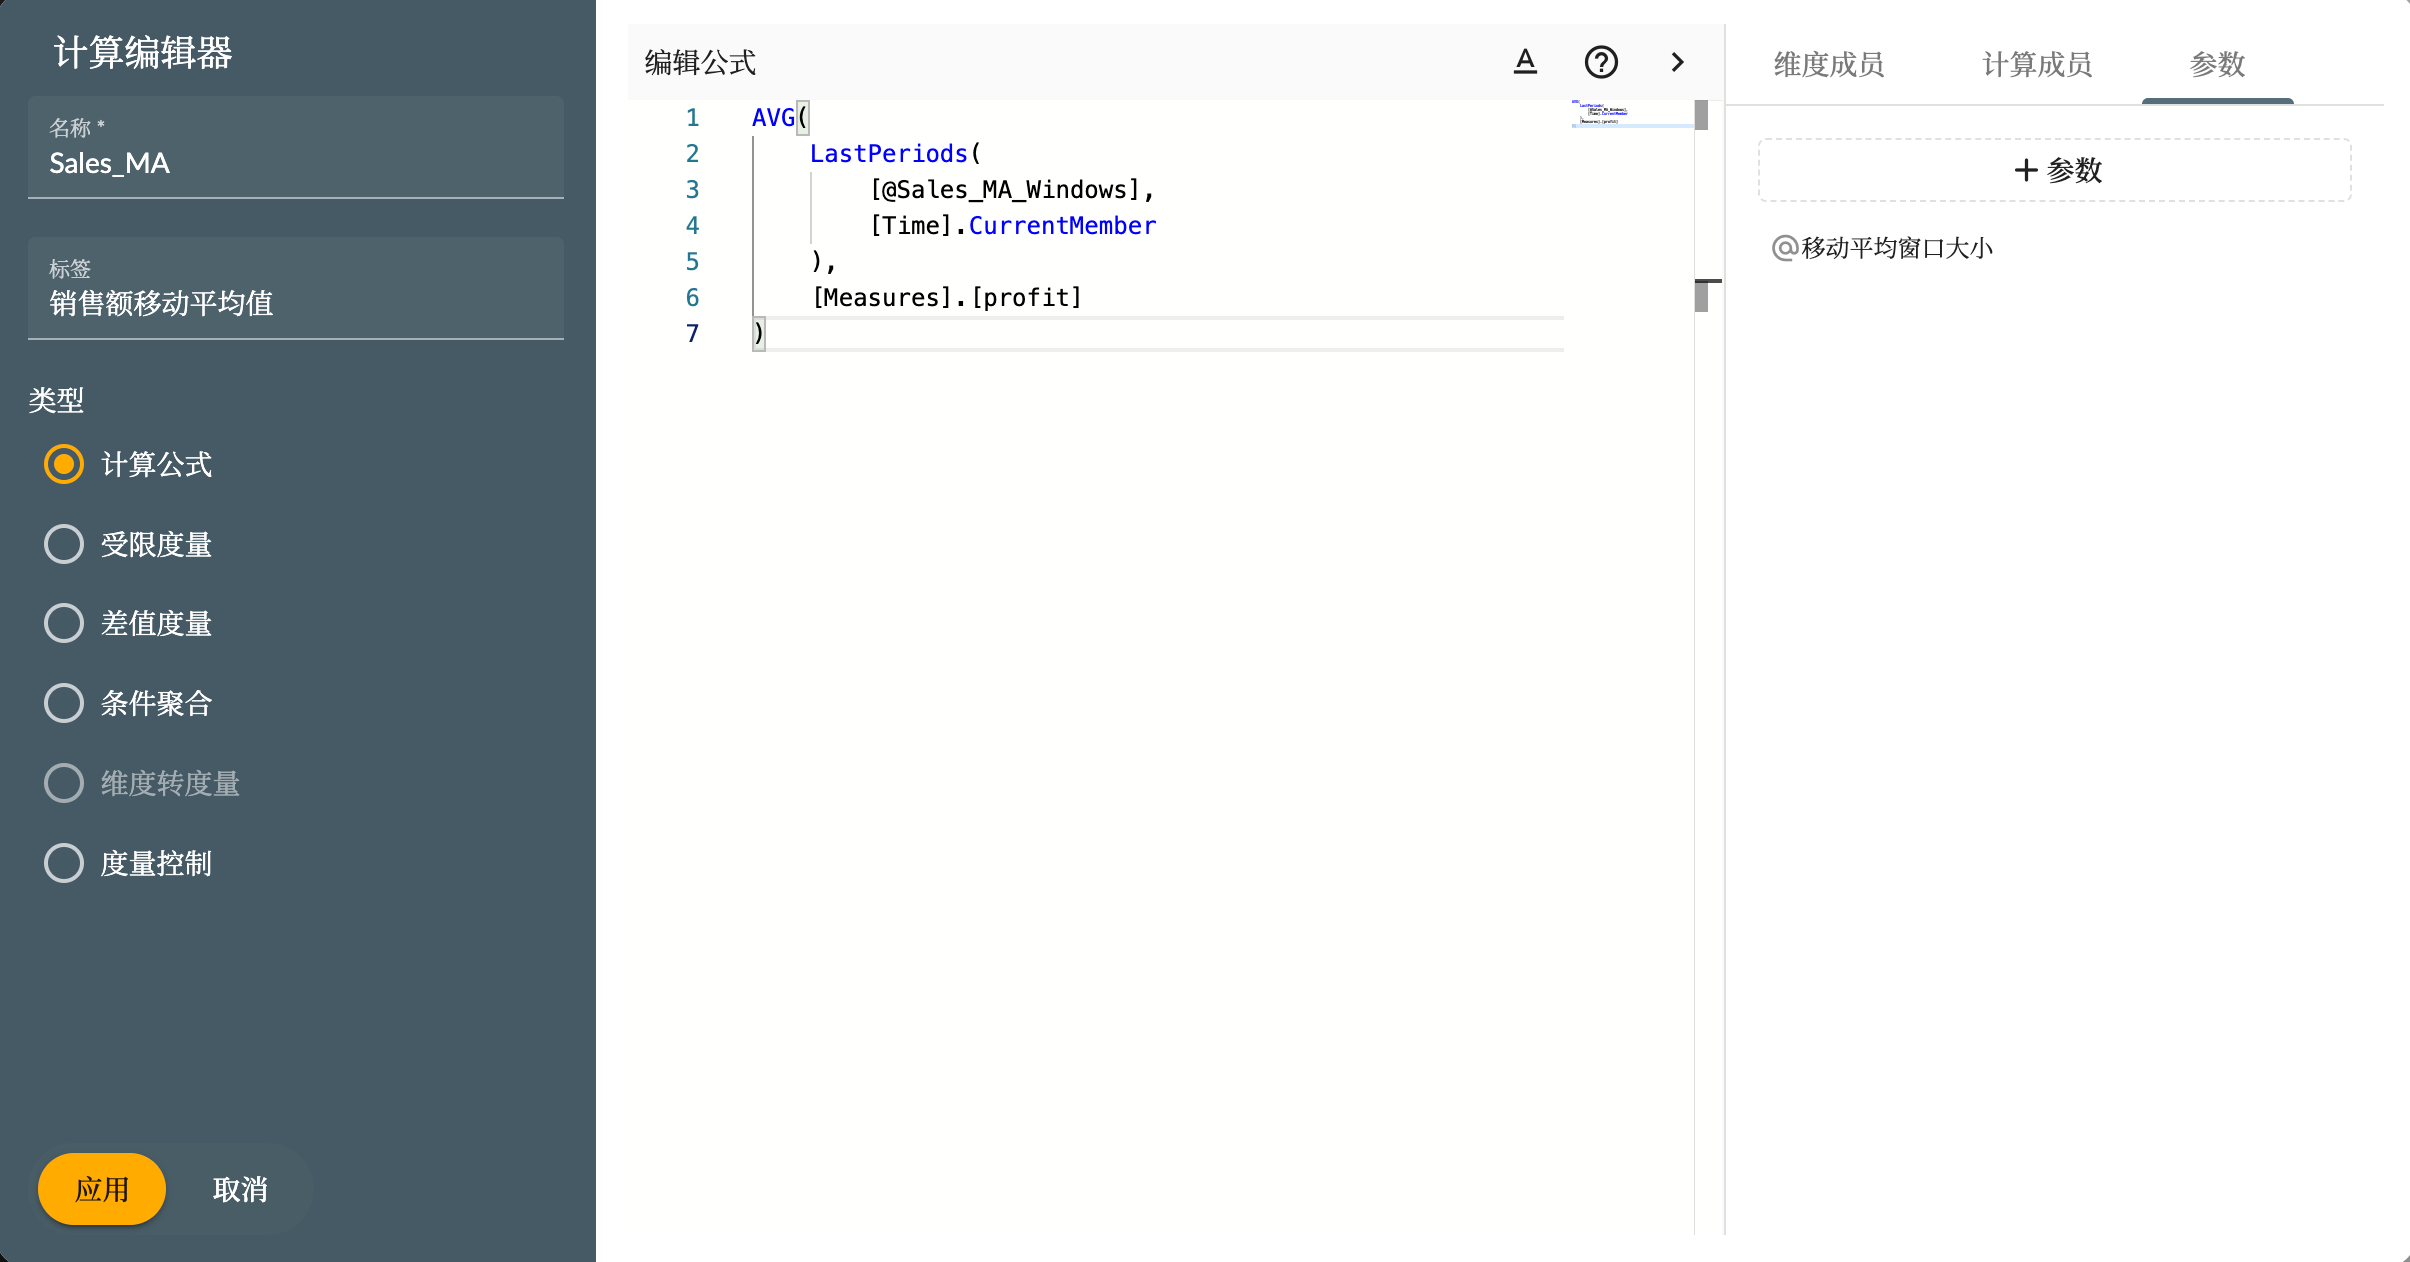
计算公式:支持创建自定义公式进行计算,以满足特定的业务需求.
指标度量:支持从指标管理系统获取的指标作为故事的度量.
用于维度的强大组件
维度选择器:用于维度层次结构和其他属性选项的复杂组件.
成员树:用于组织和分类特定维度的数据的层次结构的丰富组件.
Xpert Cloud
多维建模
多维建模使用多维数组(也称为维度)来表示数据,每个维度代表数据维度,例如时间、地点、产品等,并提供复杂数据分析和查询的能力。
查询实验室
提供用户友好的界面,用于创建、执行和分析 SQL 查询.
以表格格式显示查询结果,允许对结果进行排序、过滤和导出.
提供编辑 SQL 查询的界面,并保存查询历史以便重复使用.
SQL 模型 & MDX 模型
MDX(多维表达式)建模使用 MDX 语言通过数据库中的元数据来定义维度、层次结构和立方体,以支持复杂的数据分析,
SQL 建模也可以创建维度、层次结构和立方体,但它是通过将它们直接转换为 SQL 语句来执行查询和进行分析的,
授权 & 访问控制
确保只有授权的个人或组织才能访问敏感或机密数据
基于角色:为不同的用户或组定义角色,并为每个角色分配特定的权限
基于维度和成员:控制对多维数据模型中的单个成员或维度的访问
喜欢自主部署解决方案?您的服务器,您的基础设施,您掌控全局。
Xpert Cloud
指标管理系统
一种全面的工具,为组织提供定义、跟踪和管理与业务相关的关键绩效指标(KPI)的能力。该解决方案帮助组织监测业务绩效,做出数据驱动的决策,提高整体结果。
指标应用程序
指标应用程序是用于分析和评估公司业务和财务数据的工具。
数据: 从不同的数据模型来源,如销售数据、财务数据等收集数据,以便对不同的指标进行评估.
组织: 整理数据并确保数据质量,以便获得准确的指标.
数据可视化:提供不同的数据视图,例如时间趋势、地理位置等,以更直观地评估指标。
指标市场
指标市场是指标管理系统的核心模块,是入口。它提供了一系列功能,包括指标概述、指标注册、指标搜索和查看、详细显示、访问申请和认证。
完全有理由去尝试个人用户和小团队免费使用。
用户怎么说
不管您的数据是一个模型还是一千个,Xpert 都会使您的分析保持快速,并使您的指标易于维护。
元数多维数据分析云是一个强大且多功能的解决方案,适用于希望深入了解数据的组织。它使用多维立方体,支持复杂的数据分析,以及强大的可视化工具,使其成为以有意义和有影响力的方式分析和呈现数据的理想平台。此外,其访问控制和授权功能提供了一层安全和数据保护,使其成为各种规模业务的可靠和安全解决方案。
准备好洞察你的大数据?将你的数据源连接到分析云
保持最新
Xpert 发展很快,保持联系!
加入 Xpert 社区,紧跟快速更新的版本和功能,指南和方法,事件和新鲜的视频教程,保持获取最新动态.


