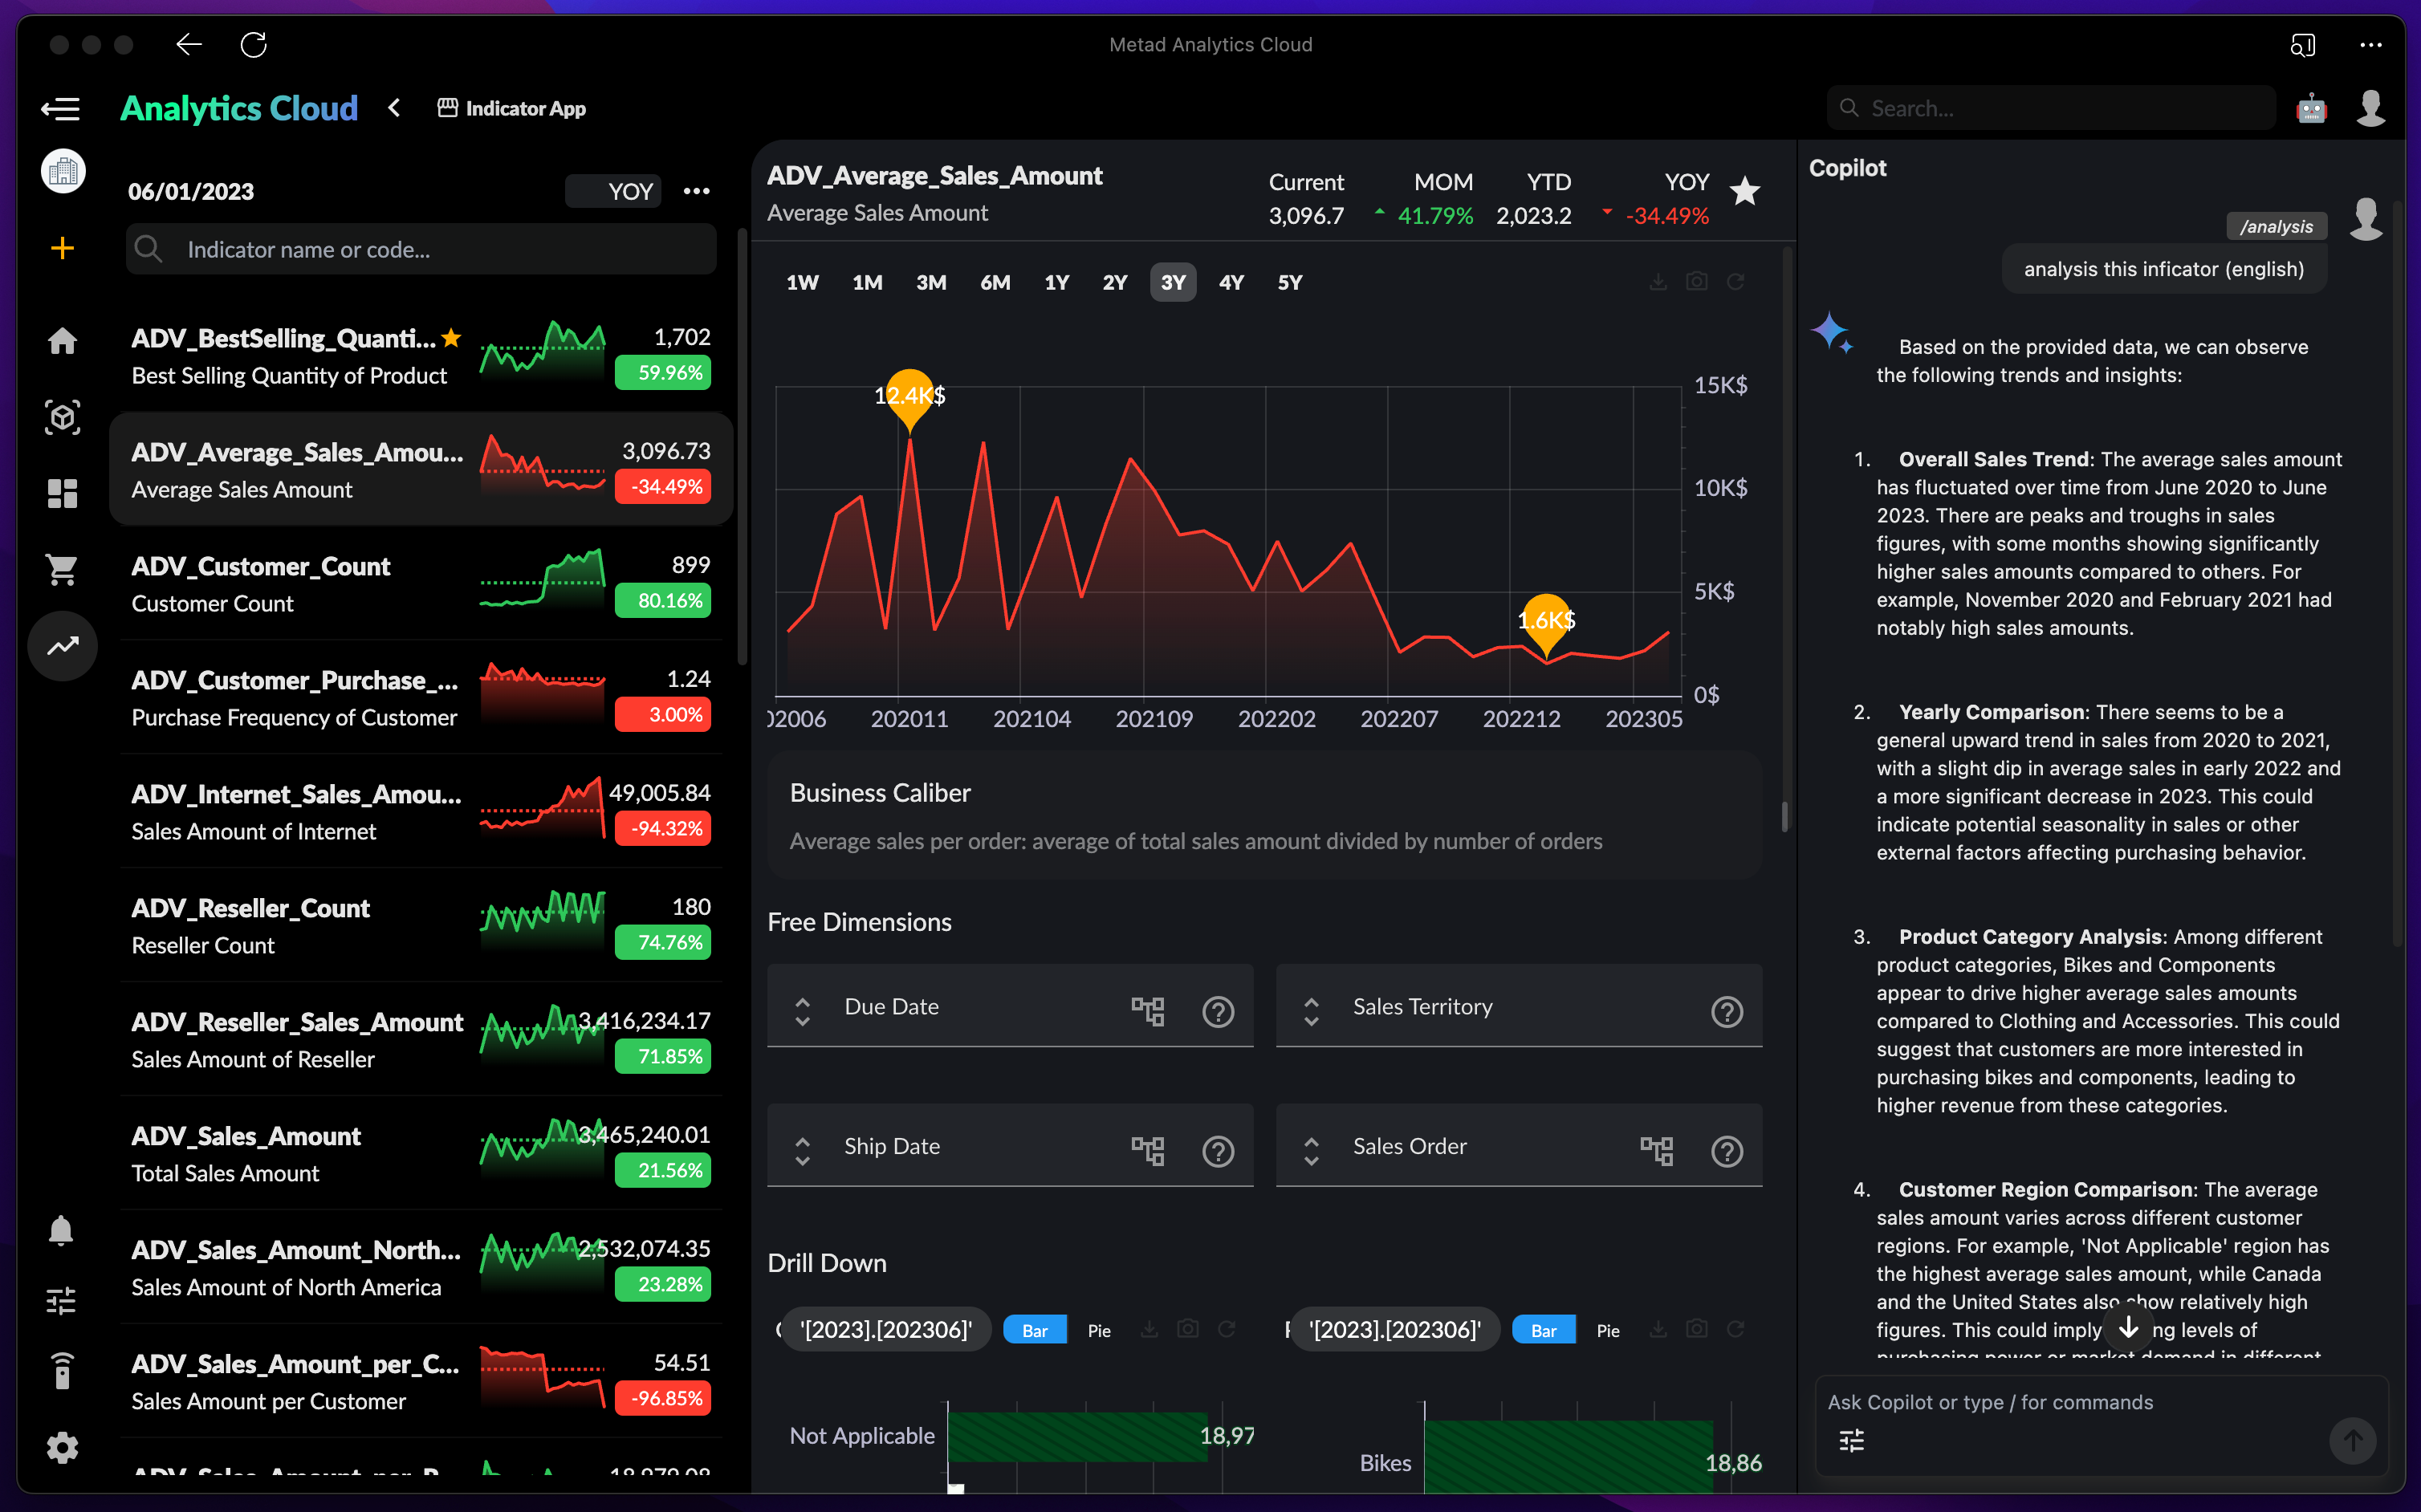
📱 Indicator Application
The Indicator Application is an application page used to display the indicator data you have permission to access. Users can utilize this application to view, compare, and analyze data from different indicators. Additionally, AI Copilot can assist you in analyzing indicator data.
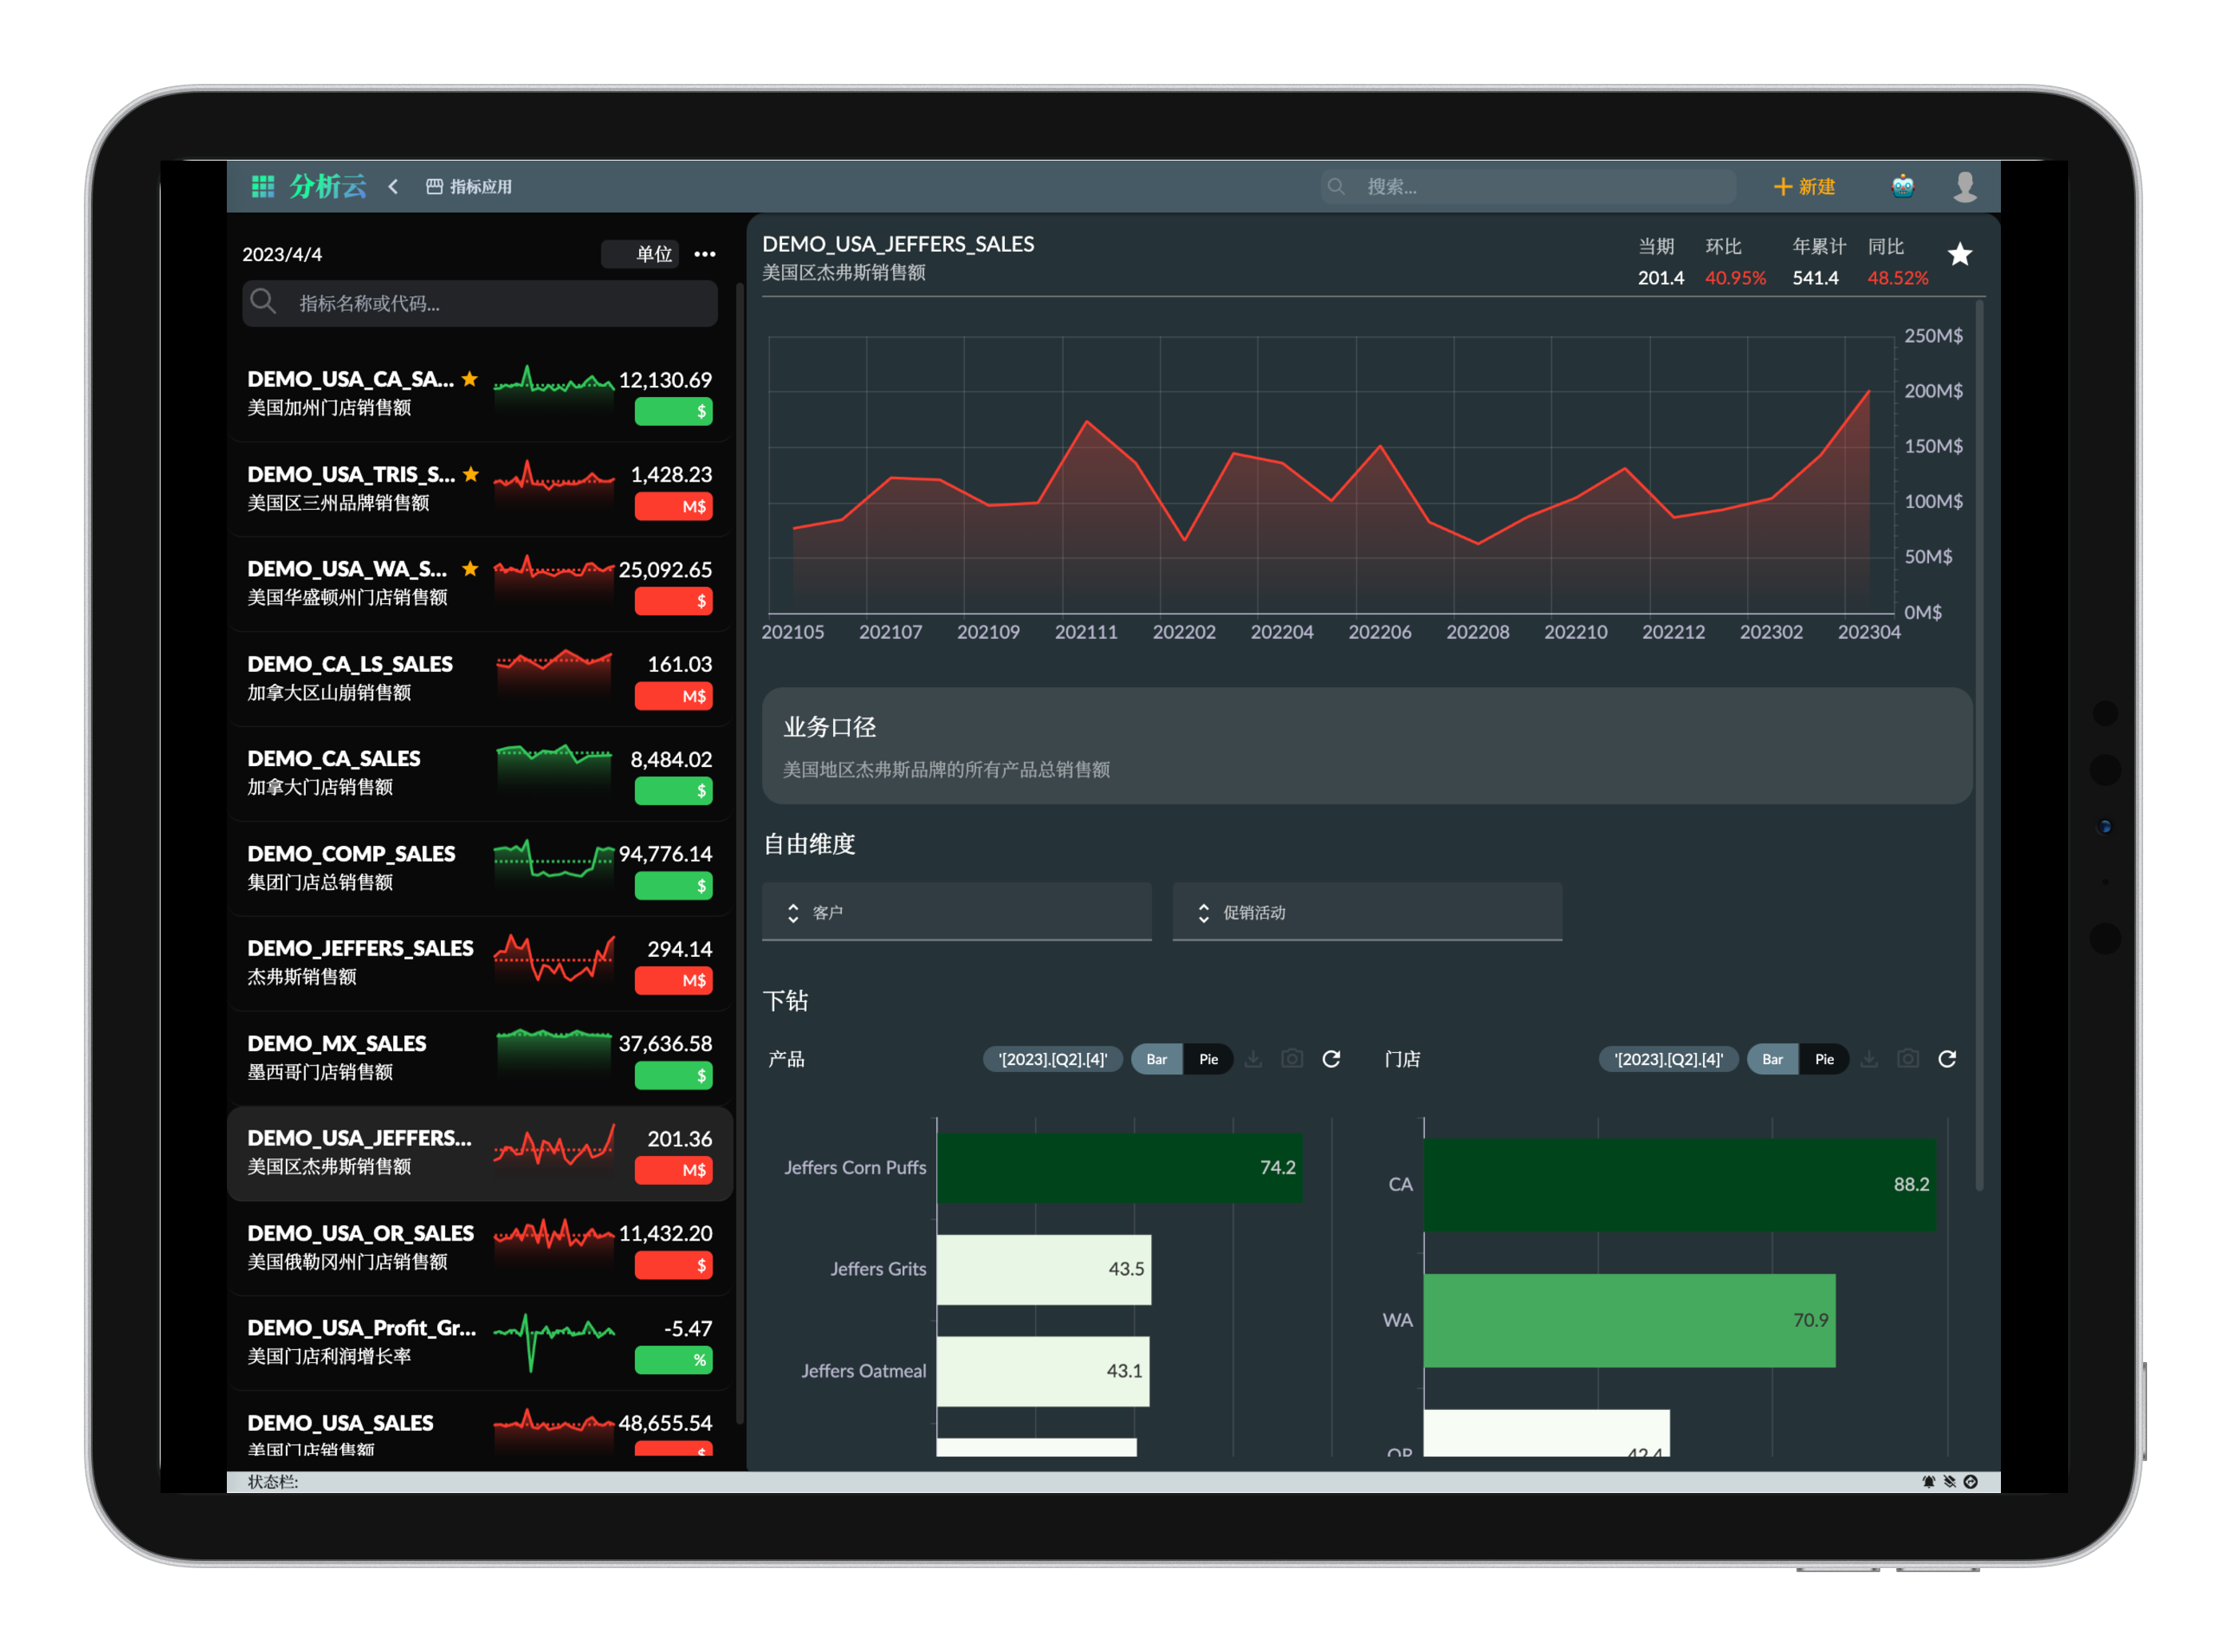
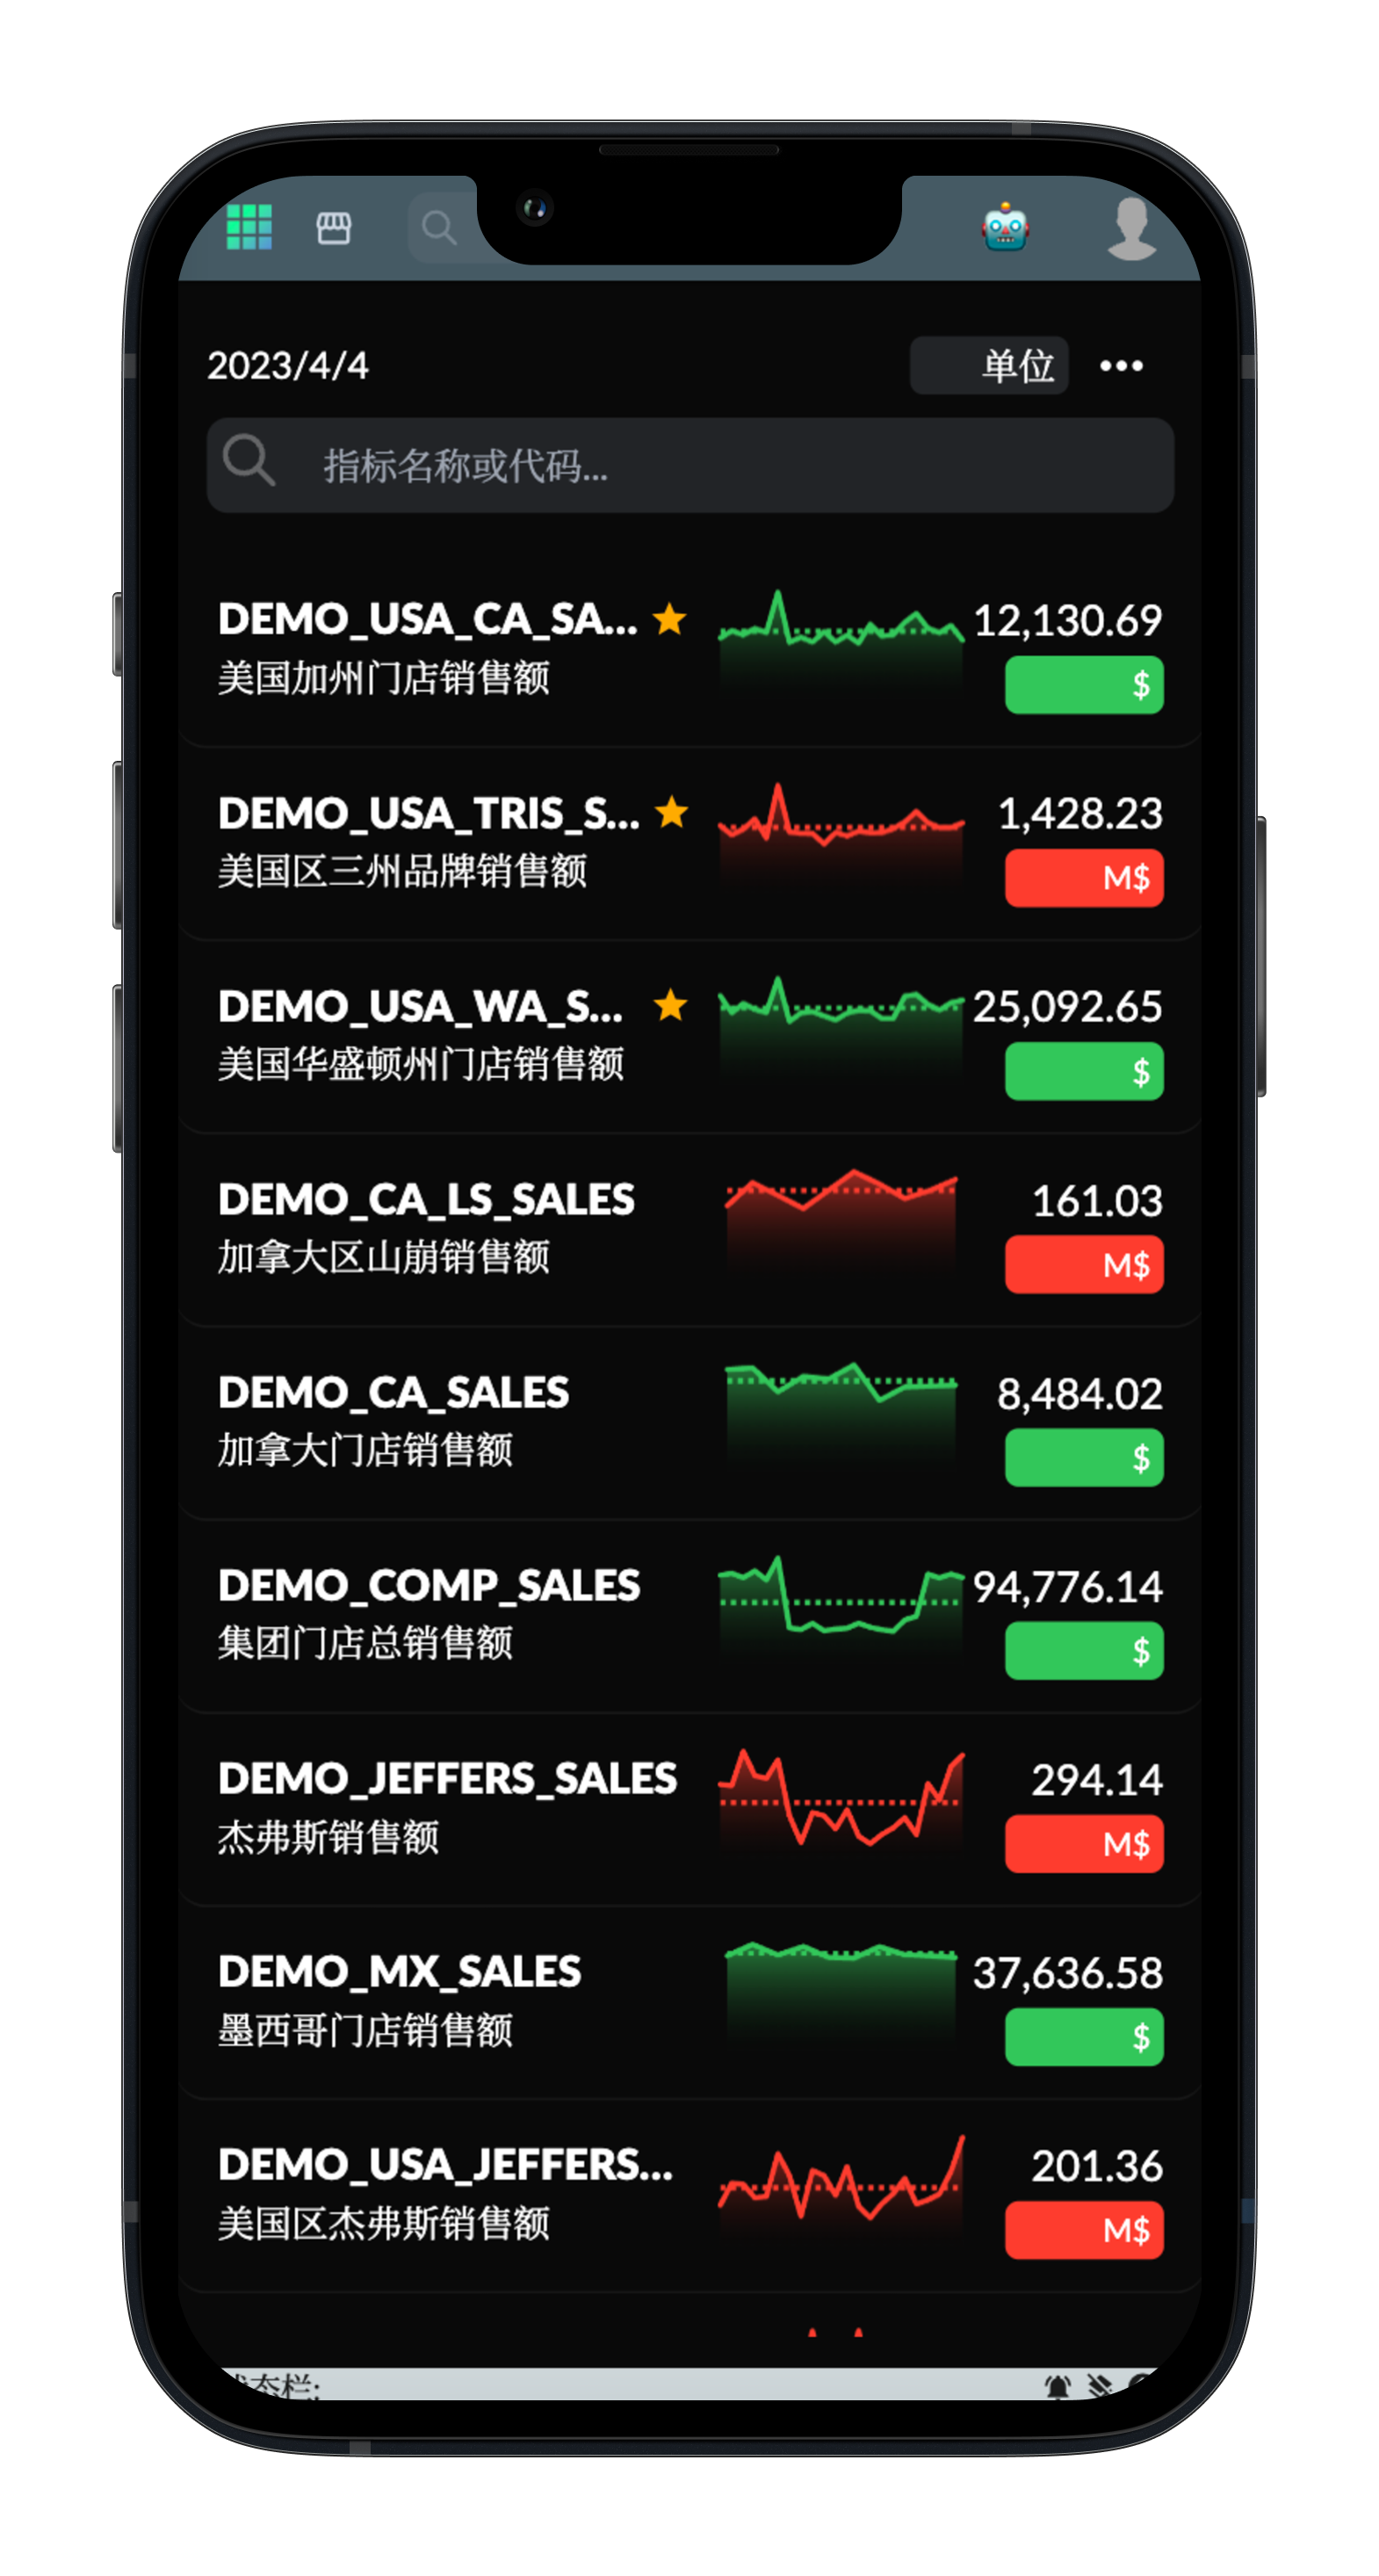
Indicator List
The Indicator Application will first display all the indicators for which users have obtained permissions in the indicator market, such as financial indicators, market indicators, sales indicators, etc.
- Current Date: Select the current date based on which all indicators are displayed.
- Unit, Year-over-Year (YoY), Quarter-over-Quarter (QoQ): Toggle the display content of each indicator, which can be switched among three data types.
- Settings Menu:
- Time Granularity: Switch time granularity: year, quarter, month, day. Statistics indicators based on different time granularities.
- Time Range: Define historical time intervals to view indicator data from a certain period to the present.
- Refresh: Force refresh all indicator data.
- Search: Search for indicators in all lists for which permissions have been obtained based on indicator names or codes.
- Favorites: Bookmark indicators to display them at the top for convenient daily viewing and comparison.
Except for the current date, all other settings will be saved in the user configuration and will be automatically loaded the next time the application is opened.
Indicator Details
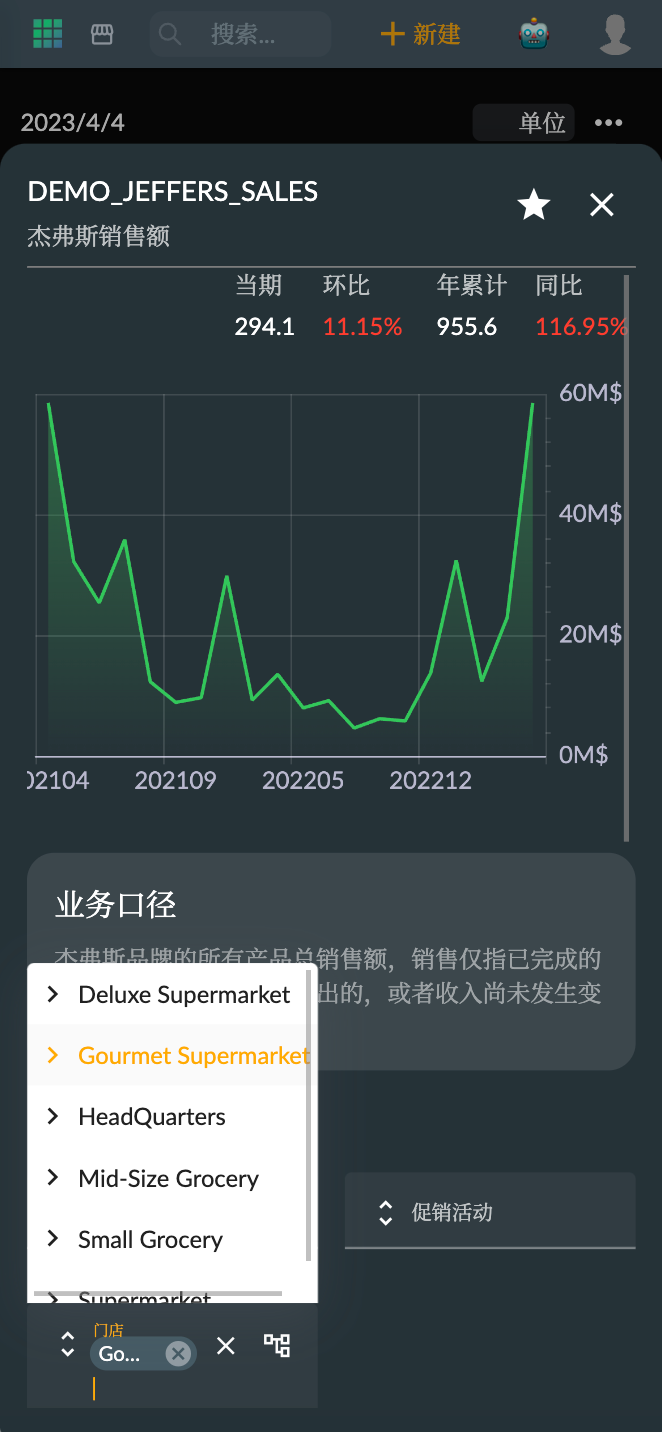
Click on a specific indicator to view its details, including the historical data trend chart, facilitating the analysis of indicator changes and predicting future trends.
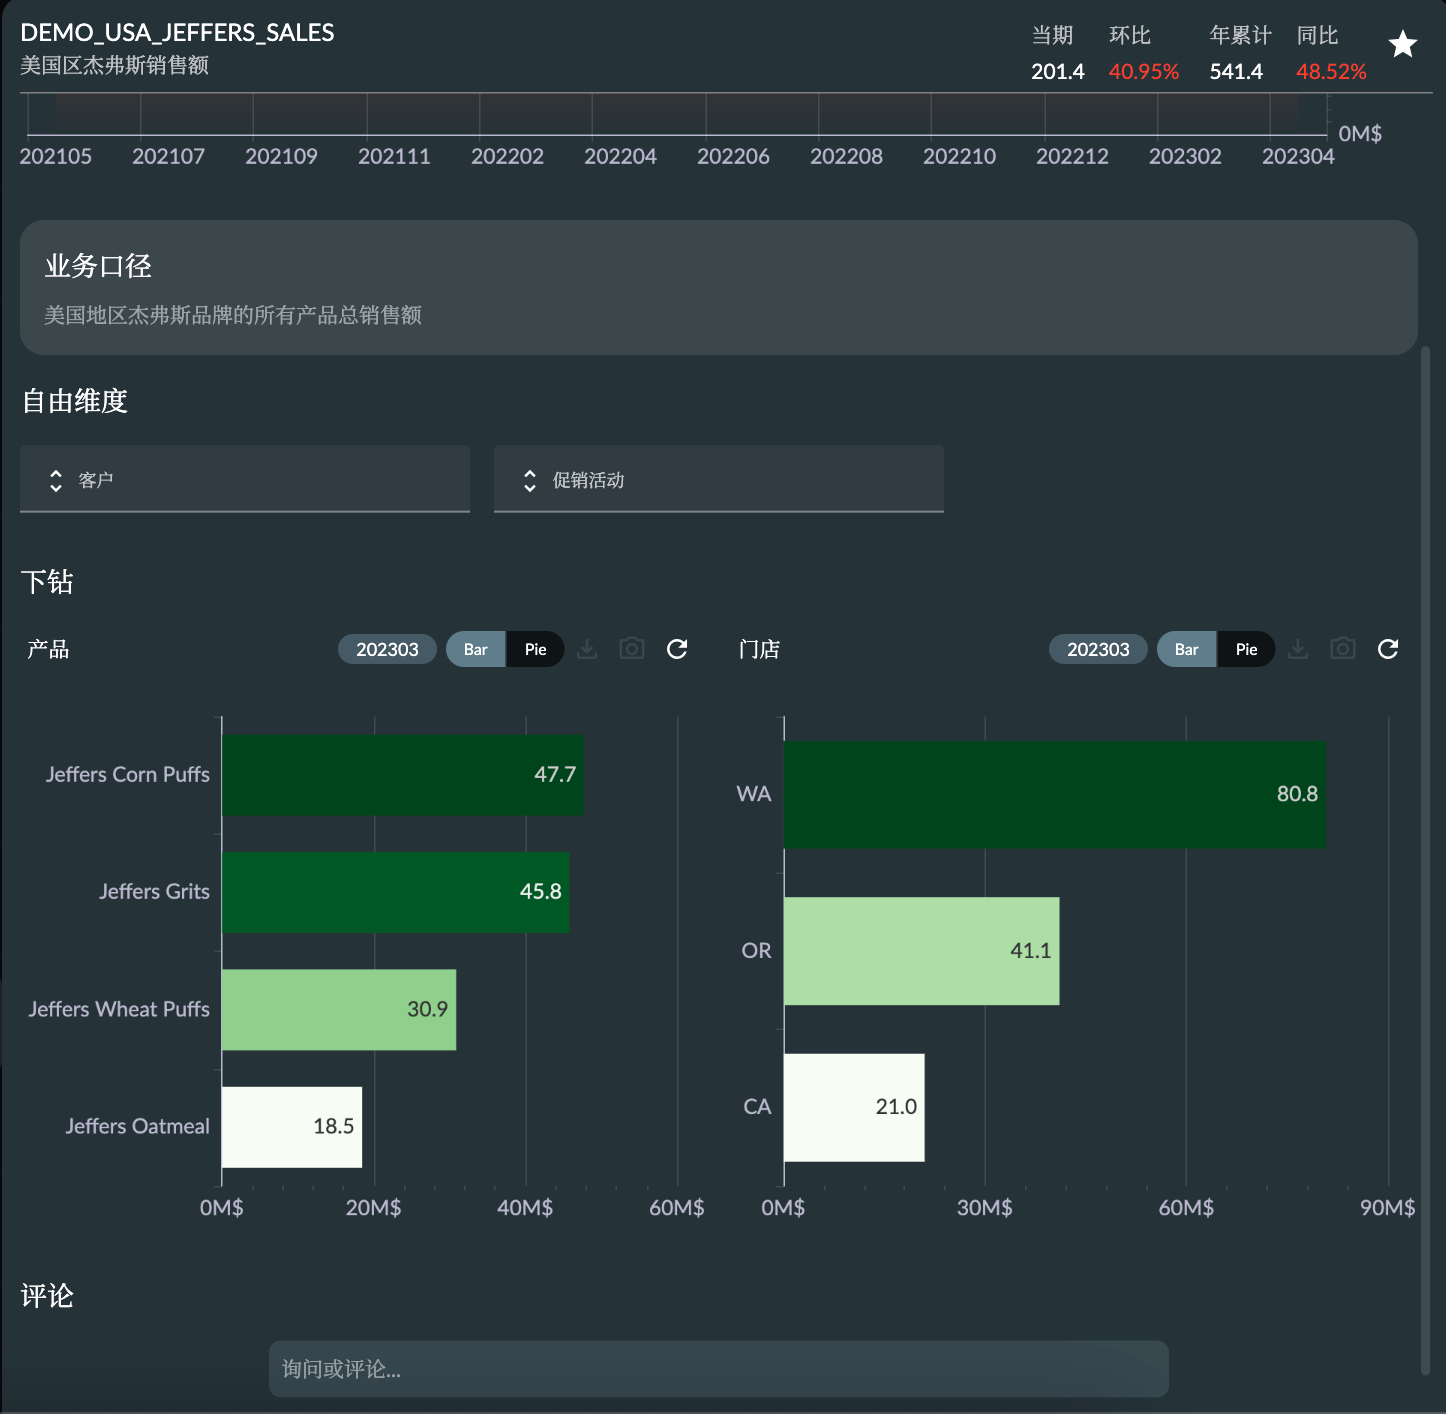
The header of the detail page displays:
Current Period: The current period's indicator value. QoQ: The indicator data quarter-over-quarter ratio. Year-to-Date (YTD): The current year-to-date value of the indicator data. YoY: The indicator data year-over-year ratio.
Business Caliber
Business Caliber refers to the specific calculation methods and rules used when defining indicators in business analysis. It is mainly used to ensure that the results of indicators calculated by different people, at different times, and in different systems are consistent, and to ensure the accuracy and comparability of indicators.
Drilldown
Drilldown refers to drilling down from the current indicator's constraints to the next level to analyze the composition of indicator data, facilitating the identification of factors attributing to data changes.
- Selecting different time periods in the indicator trend chart can filter drilldown graph data.
- There are two types of drilldown graphs: bar charts and pie charts, which can be toggled to compare the relationship and ranking of data over time.
- Clicking on graph data items can further drill down to the next level of data (if available).
Free Dimensions
Free Dimensions refer to dimensions without set constraints. Here, you can once again select filtering conditions for these dimensions to analyze factors other than the indicator's own constraints. Each free dimension allows selecting a dimension member as a filtering condition from its hierarchical structure.
- The dimension member selector supports search functionality, allowing searching by dimension member name or key value.
- Currently, only single dimension members are supported for selection.
- Supports toggling the dimension's hierarchical structure (if multiple are available).
- Dimensions set as time dimensions will not appear in free dimensions (even if set as free dimensions).
Comments
Comments refer to users commenting (or referring to AI Copilot's replies) on the status of indicator data, enabling them to share their views and thoughts with other users, allowing business managers or employees to better understand the actual situation of the indicators.
- Period-related: Comments related to the period will be filtered out after selecting the period, while those unrelated to the period will always be displayed.
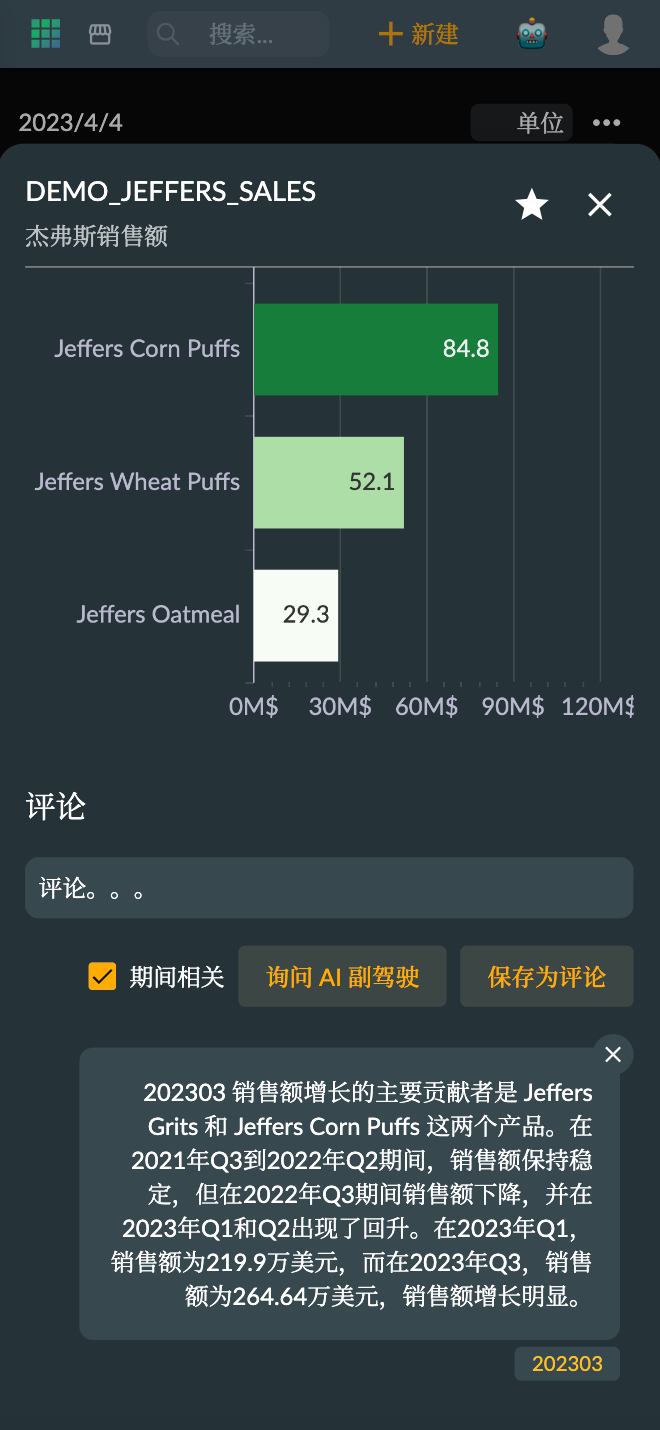
Comment permissions are granted to the creator of the indicator or the role account modeling the domain to which the indicator belongs.
AI Copilot
/analysis This AI command allows users to ask the AI Copilot for assistance in analyzing the current indicator's data, enabling artificial intelligence to provide suggestions for the questions you ask.
