Query Logs
The Query Logs feature helps users more comprehensively monitor and analyze the query performance of semantic models. This feature records detailed information about all queries, including query status, execution time, query parameters, and results. Users can view the query logs through the interface to optimize query performance, troubleshoot issues, and improve system stability.
Feature Highlights
- Global Query Log Management (In Development): Records all query requests, with filtering support based on model, query status, and other conditions.
- Visualized Log Interface: Adds a query log page within the semantic model, providing an intuitive display of query execution details.
- Performance Monitoring: Offers
executionTimeandwaitingTimemetrics to help users analyze query response speed. - Error Tracking: Includes an
errorfield in the logs, making it easy for developers and administrators to troubleshoot issues. - Historical Log Retrieval: Supports storing and querying historical logs to facilitate query strategy optimization.
- Automatic Log Cleanup Mechanism: Automatically clears expired logs based on a policy (30-day limit).
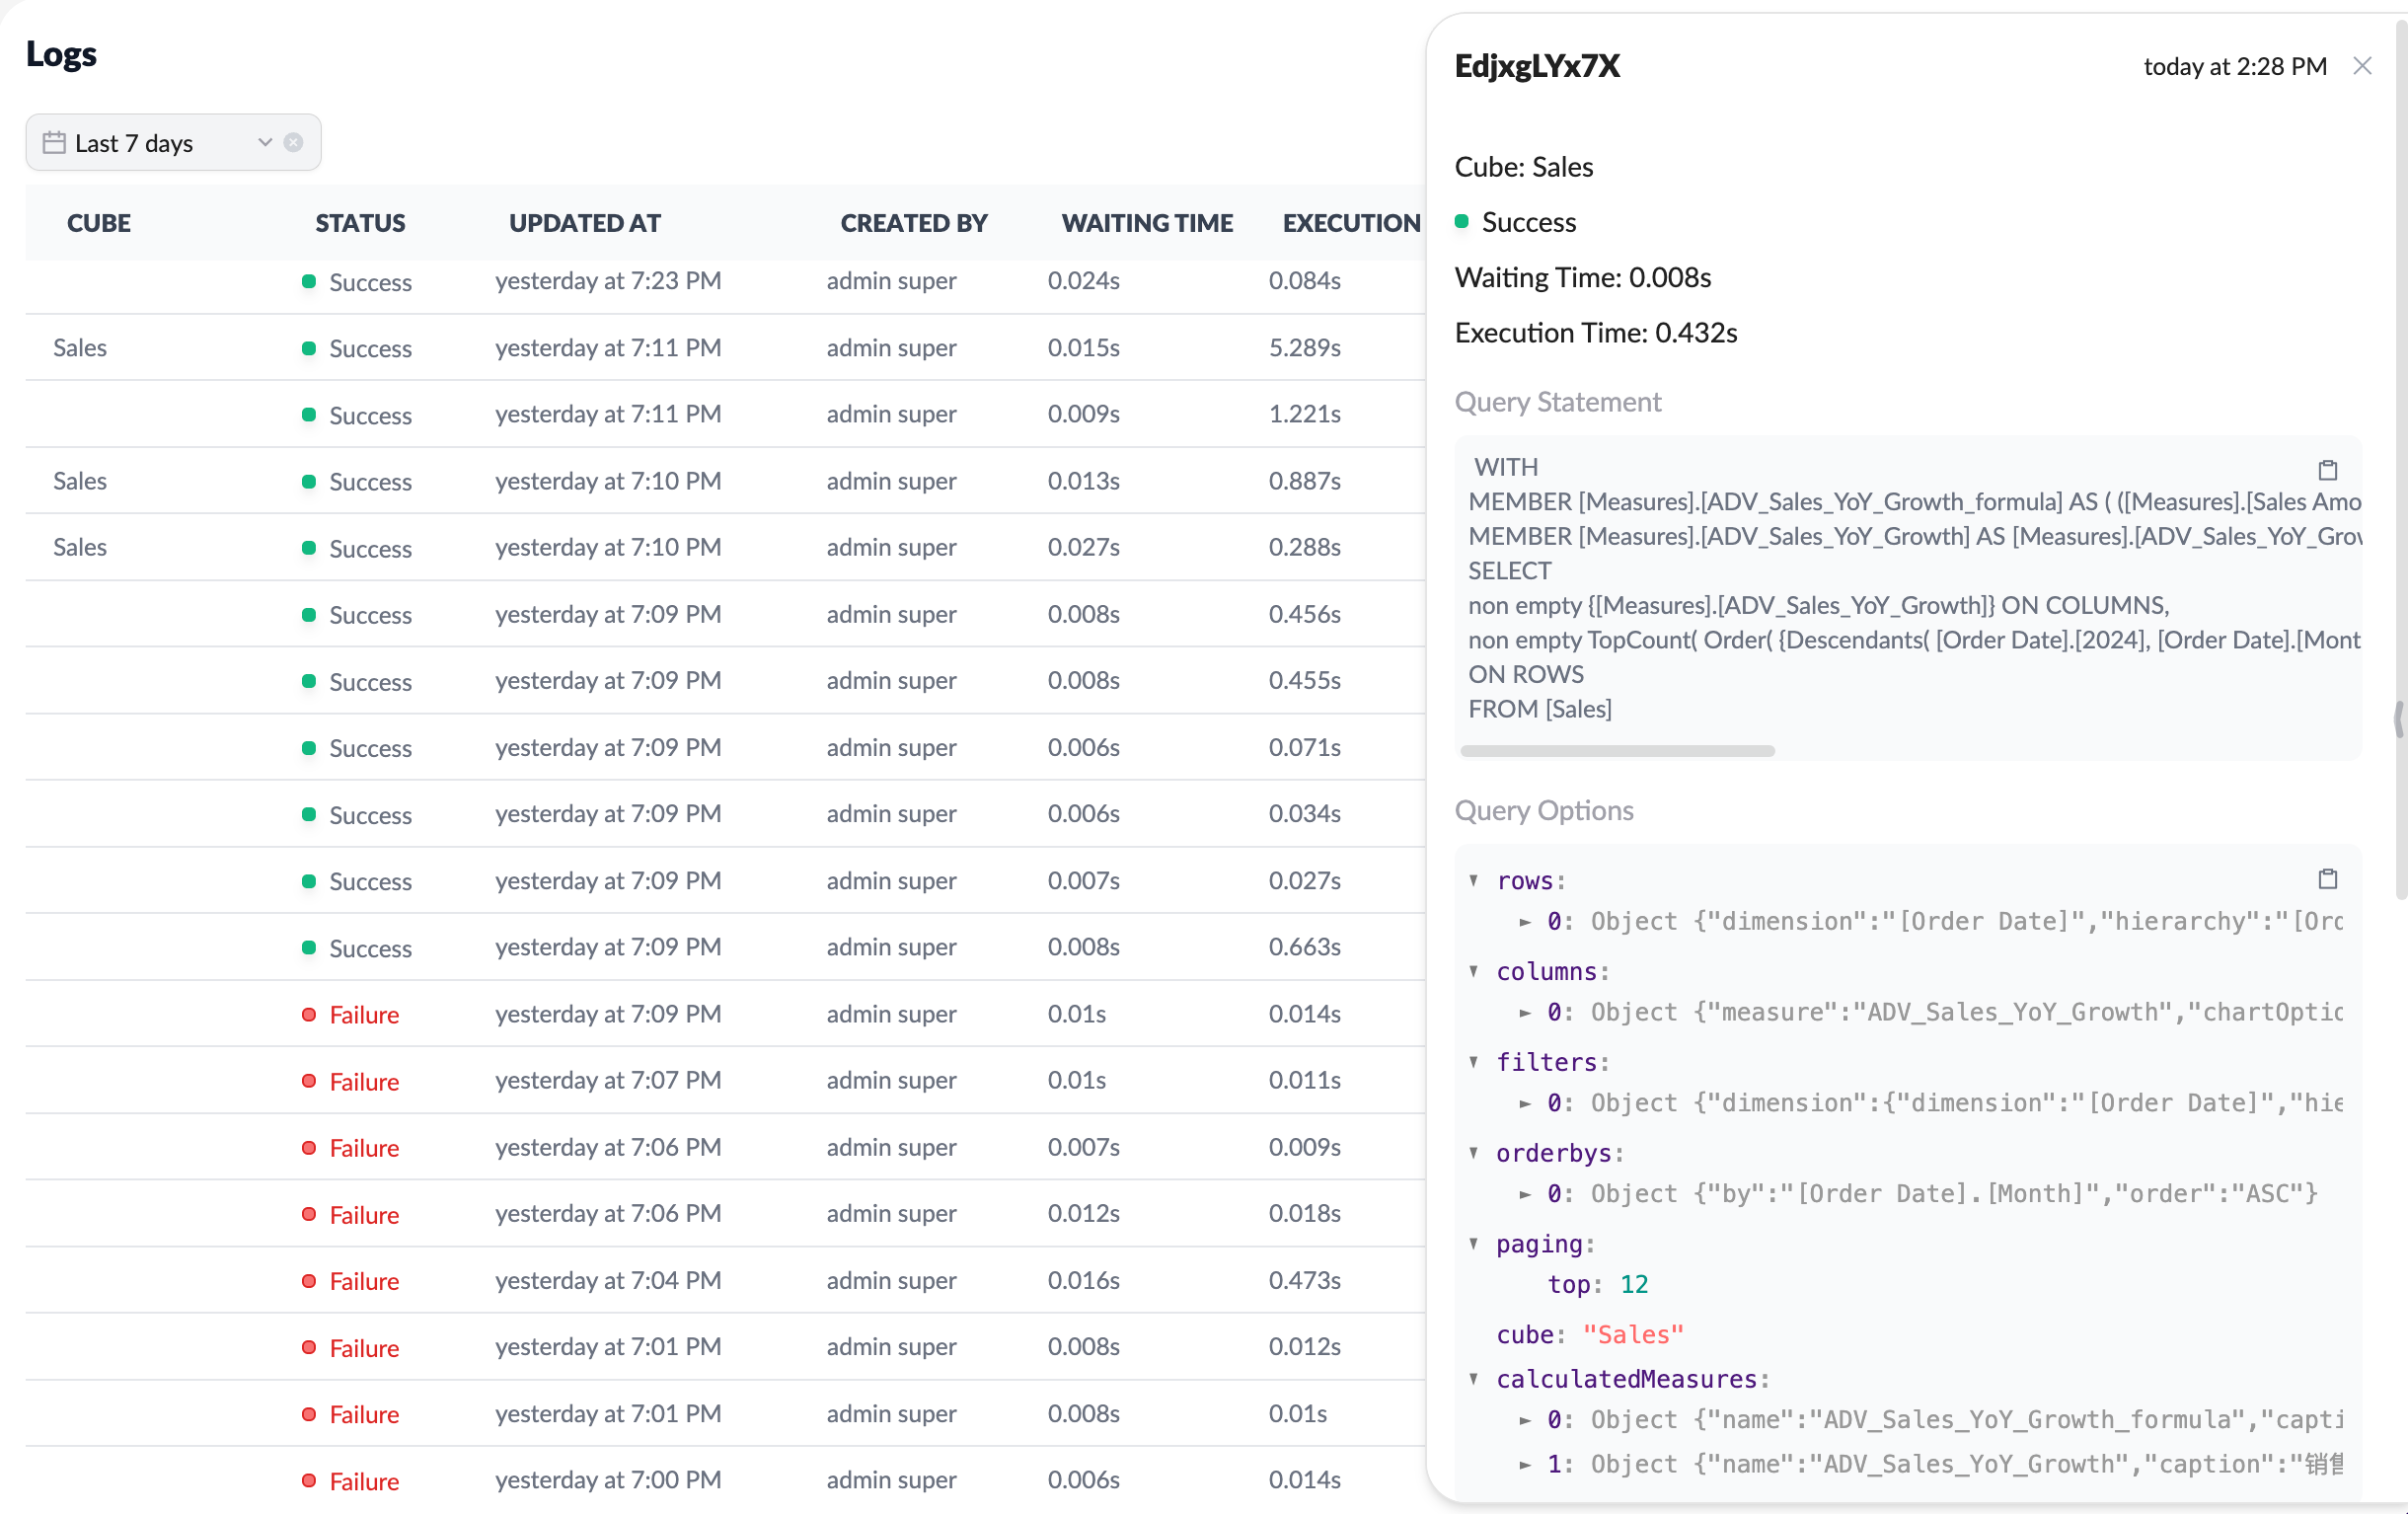
Query Logs Interface
A dedicated Query Logs Page is provided under the "Manage" menu in the semantic model, where users can:
- Filter Logs: Filter by semantic model, query status, execution time, and other conditions.
- View Details: Click a log entry to expand and view full query parameters, execution results, and error messages.
- Copy Logs: Copy query information from the logs, including parameters, query statements, and results, for further analysis.
Use Cases
- Performance Optimization: Analyze
executionTimeandwaitingTimeto identify slow queries and optimize the model. - Troubleshooting: When a query fails, check the
errorfield to quickly pinpoint the cause. - Data Compliance Review: Query logs can be used to record and audit data access activities.
Future Plans
In future versions, we plan to further enhance the query logs feature, including:
- Real-Time Monitoring Dashboard: Provide query statistics and trend analysis.
- Alert Notifications: Trigger alerts to notify administrators when the query failure rate exceeds a threshold.
Conclusion
XpertAI’s Query Logs feature provides users with powerful query monitoring and analysis capabilities, helping to optimize semantic model query performance, enhance system stability, and improve troubleshooting efficiency. We welcome users to try it out and provide feedback so we can continuously improve and refine this feature.