🧮 Calculation Measures
Calculations in the story dashboard allow you to create calculations that are specific to the story without modifying the semantic model. There are several types of calculations you can create:
- 1. Conditional Aggregation
- 2. Restricted Measure
- 3. Calculated Measure
- 4. Measure Control
- 5. Difference Measure
- Managing Calculated Measures and Parameters
To perform these operations, add a measure in the settings interface of the analysis graph component (or any other component that uses measures). Click on the empty measure and select "Create Calculation" from the selection list. In the pop-up window, you can create members of the following calculation types:
1. Conditional Aggregation
Conditional Aggregation allows you to calculate measures based on specific conditions and aggregation functions. You can choose from the following aggregation functions:
| Aggregation Function | Description |
|---|---|
| Sum | Accumulates the values |
| Count | Counts the selected dimension members |
| Min | Calculates the minimum value for the members |
| Max | Calculates the maximum value for the members |
| Average | Calculates the average value for the members |
| Standard Deviation | Calculates the standard deviation |
| Population Standard Deviation | Calculates the population standard deviation |
| Median | Calculates the median value |
| Top Percent | Calculates the sum of the top percentage |
| Top Count | Calculates the sum of the top count |
| Top Sum | Calculates the sum of the top sum |
The following example calculates the sum of the profits for the top 3 products in all products.
Using Conditional Aggregation: The aggregation function is applied based on the selected conditions at runtime (selection or exclusion).
2. Restricted Measure
Restricted Measure refers to the measure values under certain limiting conditions. These limiting conditions may include limiting the range of variables, the relationship between variables, or the values of variables. For example, for a multidimensional dataset, you may only consider data points where one dimension member is within a specific range or where two dimension members have a specific relationship. These restrictions can help researchers better understand the data and may improve the statistical significance of the analysis.
To create a restricted measure, select the type "Restricted Measure" in the calculation editor:
- Select a measure field to be analyzed.
- Add one or more dimensions as limiting conditions and select the corresponding members or create parameters for them.
- Enable Constant Selection: When enabled, the limiting conditions will not be overridden by filters in the runtime context of the query.
Indicator is a special type of restricted measure.
Constant Selection
Constant Selection refers to the measure values under constant conditions where the limiting conditions of the restricted measure are not overridden by filters in the context environment.
On the other hand, if constant selection is not enabled, the limiting conditions of the restricted measure will be overridden by filters in the context environment.
Using Parameters for Constraints
In addition to selecting fixed dimension members as limiting conditions, you can also use parameters on the limiting dimension to allow users to choose dimension members to restrict the measure values.
See Using Parameters for Restricted Measures.
3. Calculated Measure
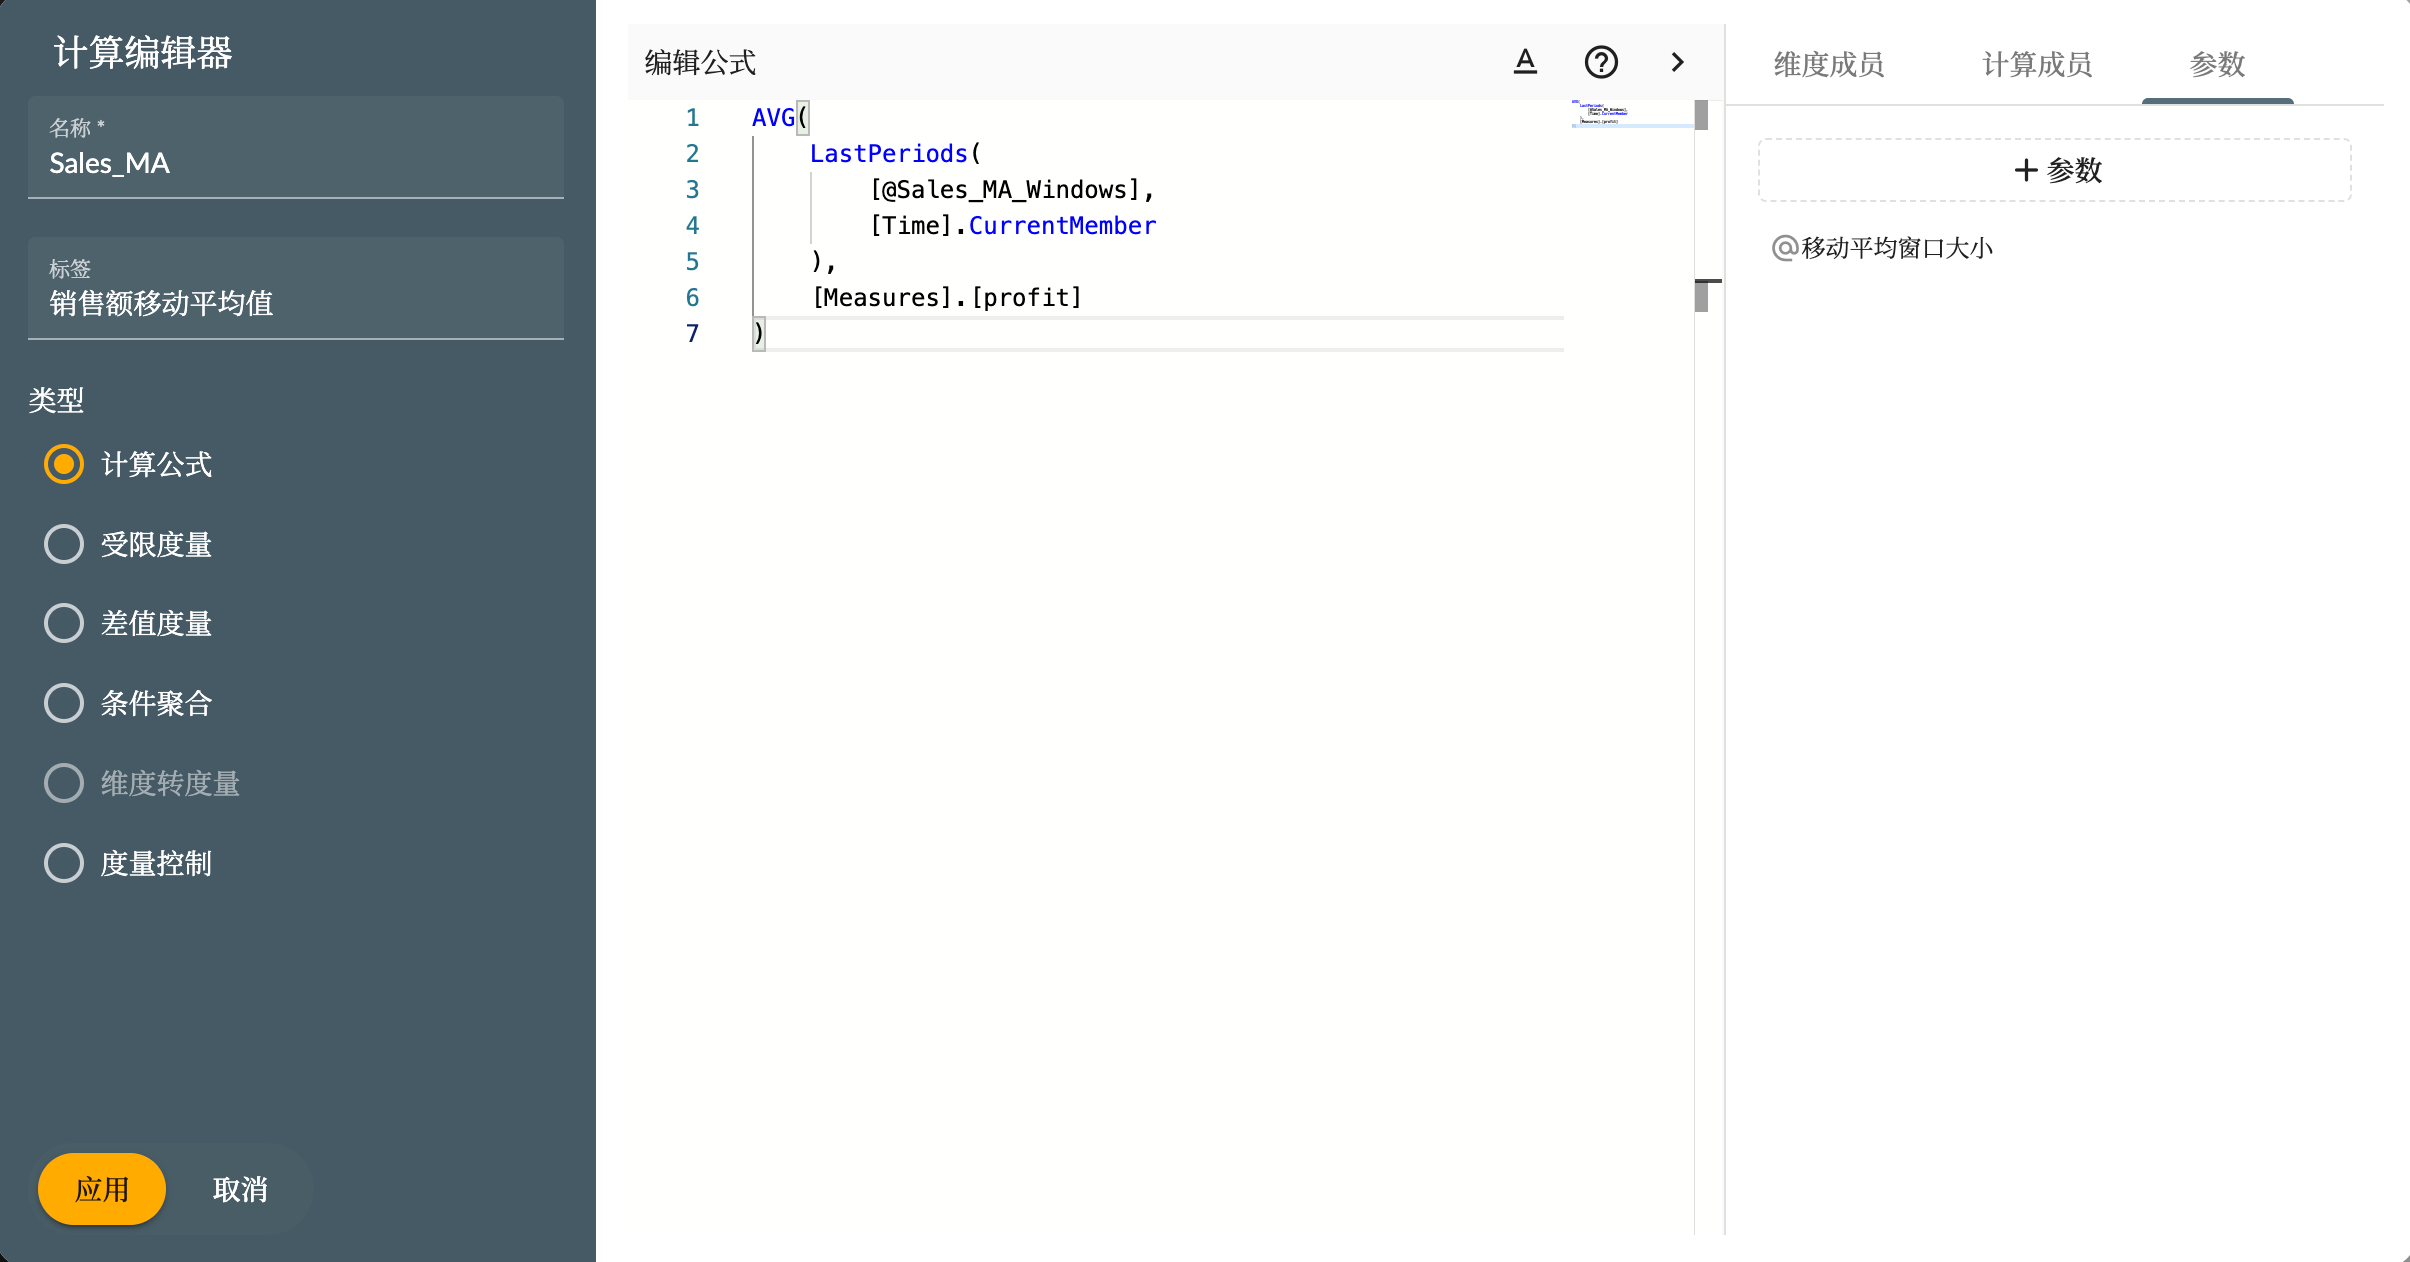
When the type is "Calculated Measure," it refers to creating a measure that calculates summary values using a custom formula. You can write formulas using MDX syntax for complex scenario calculations in the calculated measure interface.
Click the open menu button on the right side of the editor toolbar to expand the various member panels on the right:
- Dimension Members: You can see all dimension members after selecting dimensions and hierarchies. Dragging dimension members into the editor will insert their unique codes into the editor.
- Calculated Members: This lists all existing calculated members. Dragging them into the editor will insert the existing calculated member measures into the formula.
- Parameters: In the parameter area, you can create new parameters or drag existing ones into the editor to insert them into the formula.
For example, the following formula uses the parameter Sales_MA_Windows (referenced as [@Sales_MA_Windows]) and the measure profit (referenced as [Measures].[profit]):
AVG(LastPeriods([@Sales_MA_Windows], [Time].CurrentMember),[Measures].[profit])

For more details on using parameters in calculated formulas, refer to Using Parameters in Calculated Formulas.
4. Measure Control
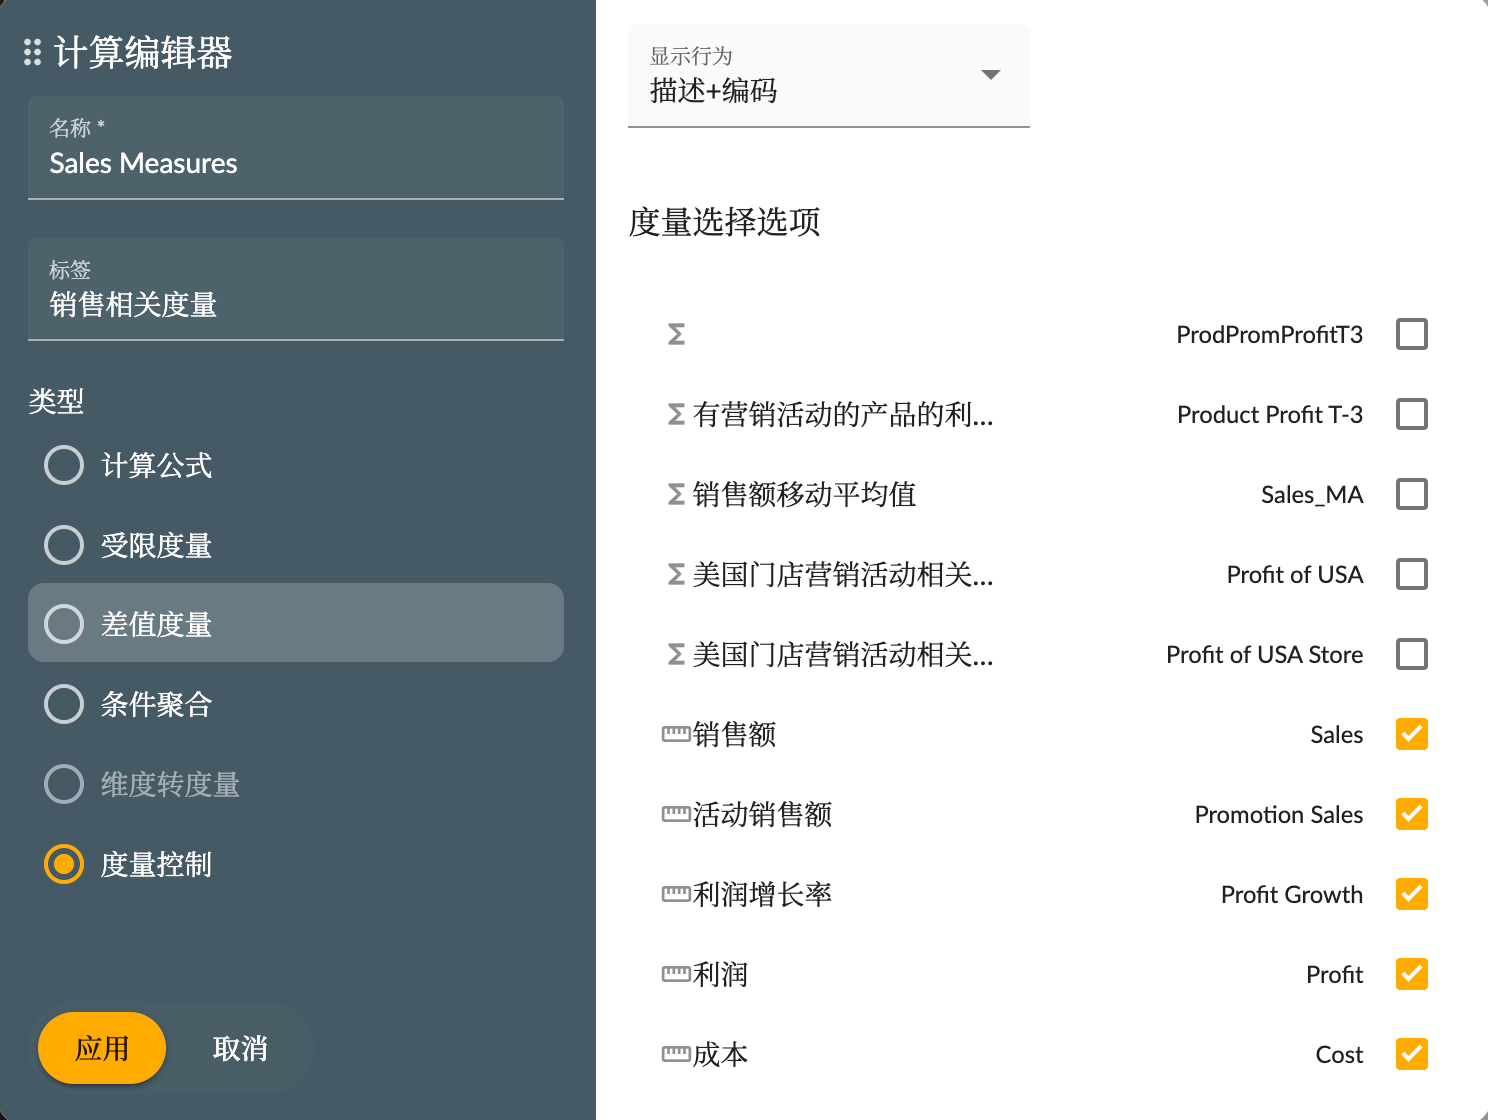
Measure Control: This type of measure field aims to point to other measures, allowing users to dynamically select the measure they want to view at runtime. The process for creating a measure control involves creating a calculated measure, selecting the type as Measure Control, choosing the display behavior, and selecting the list of measures to choose from. As shown below:

Once the measure control is successfully created, you need to create a corresponding input controller widget for the measure to actually select it, as shown below. For a detailed process, see Input Controller Widgets.
5. Difference Measure
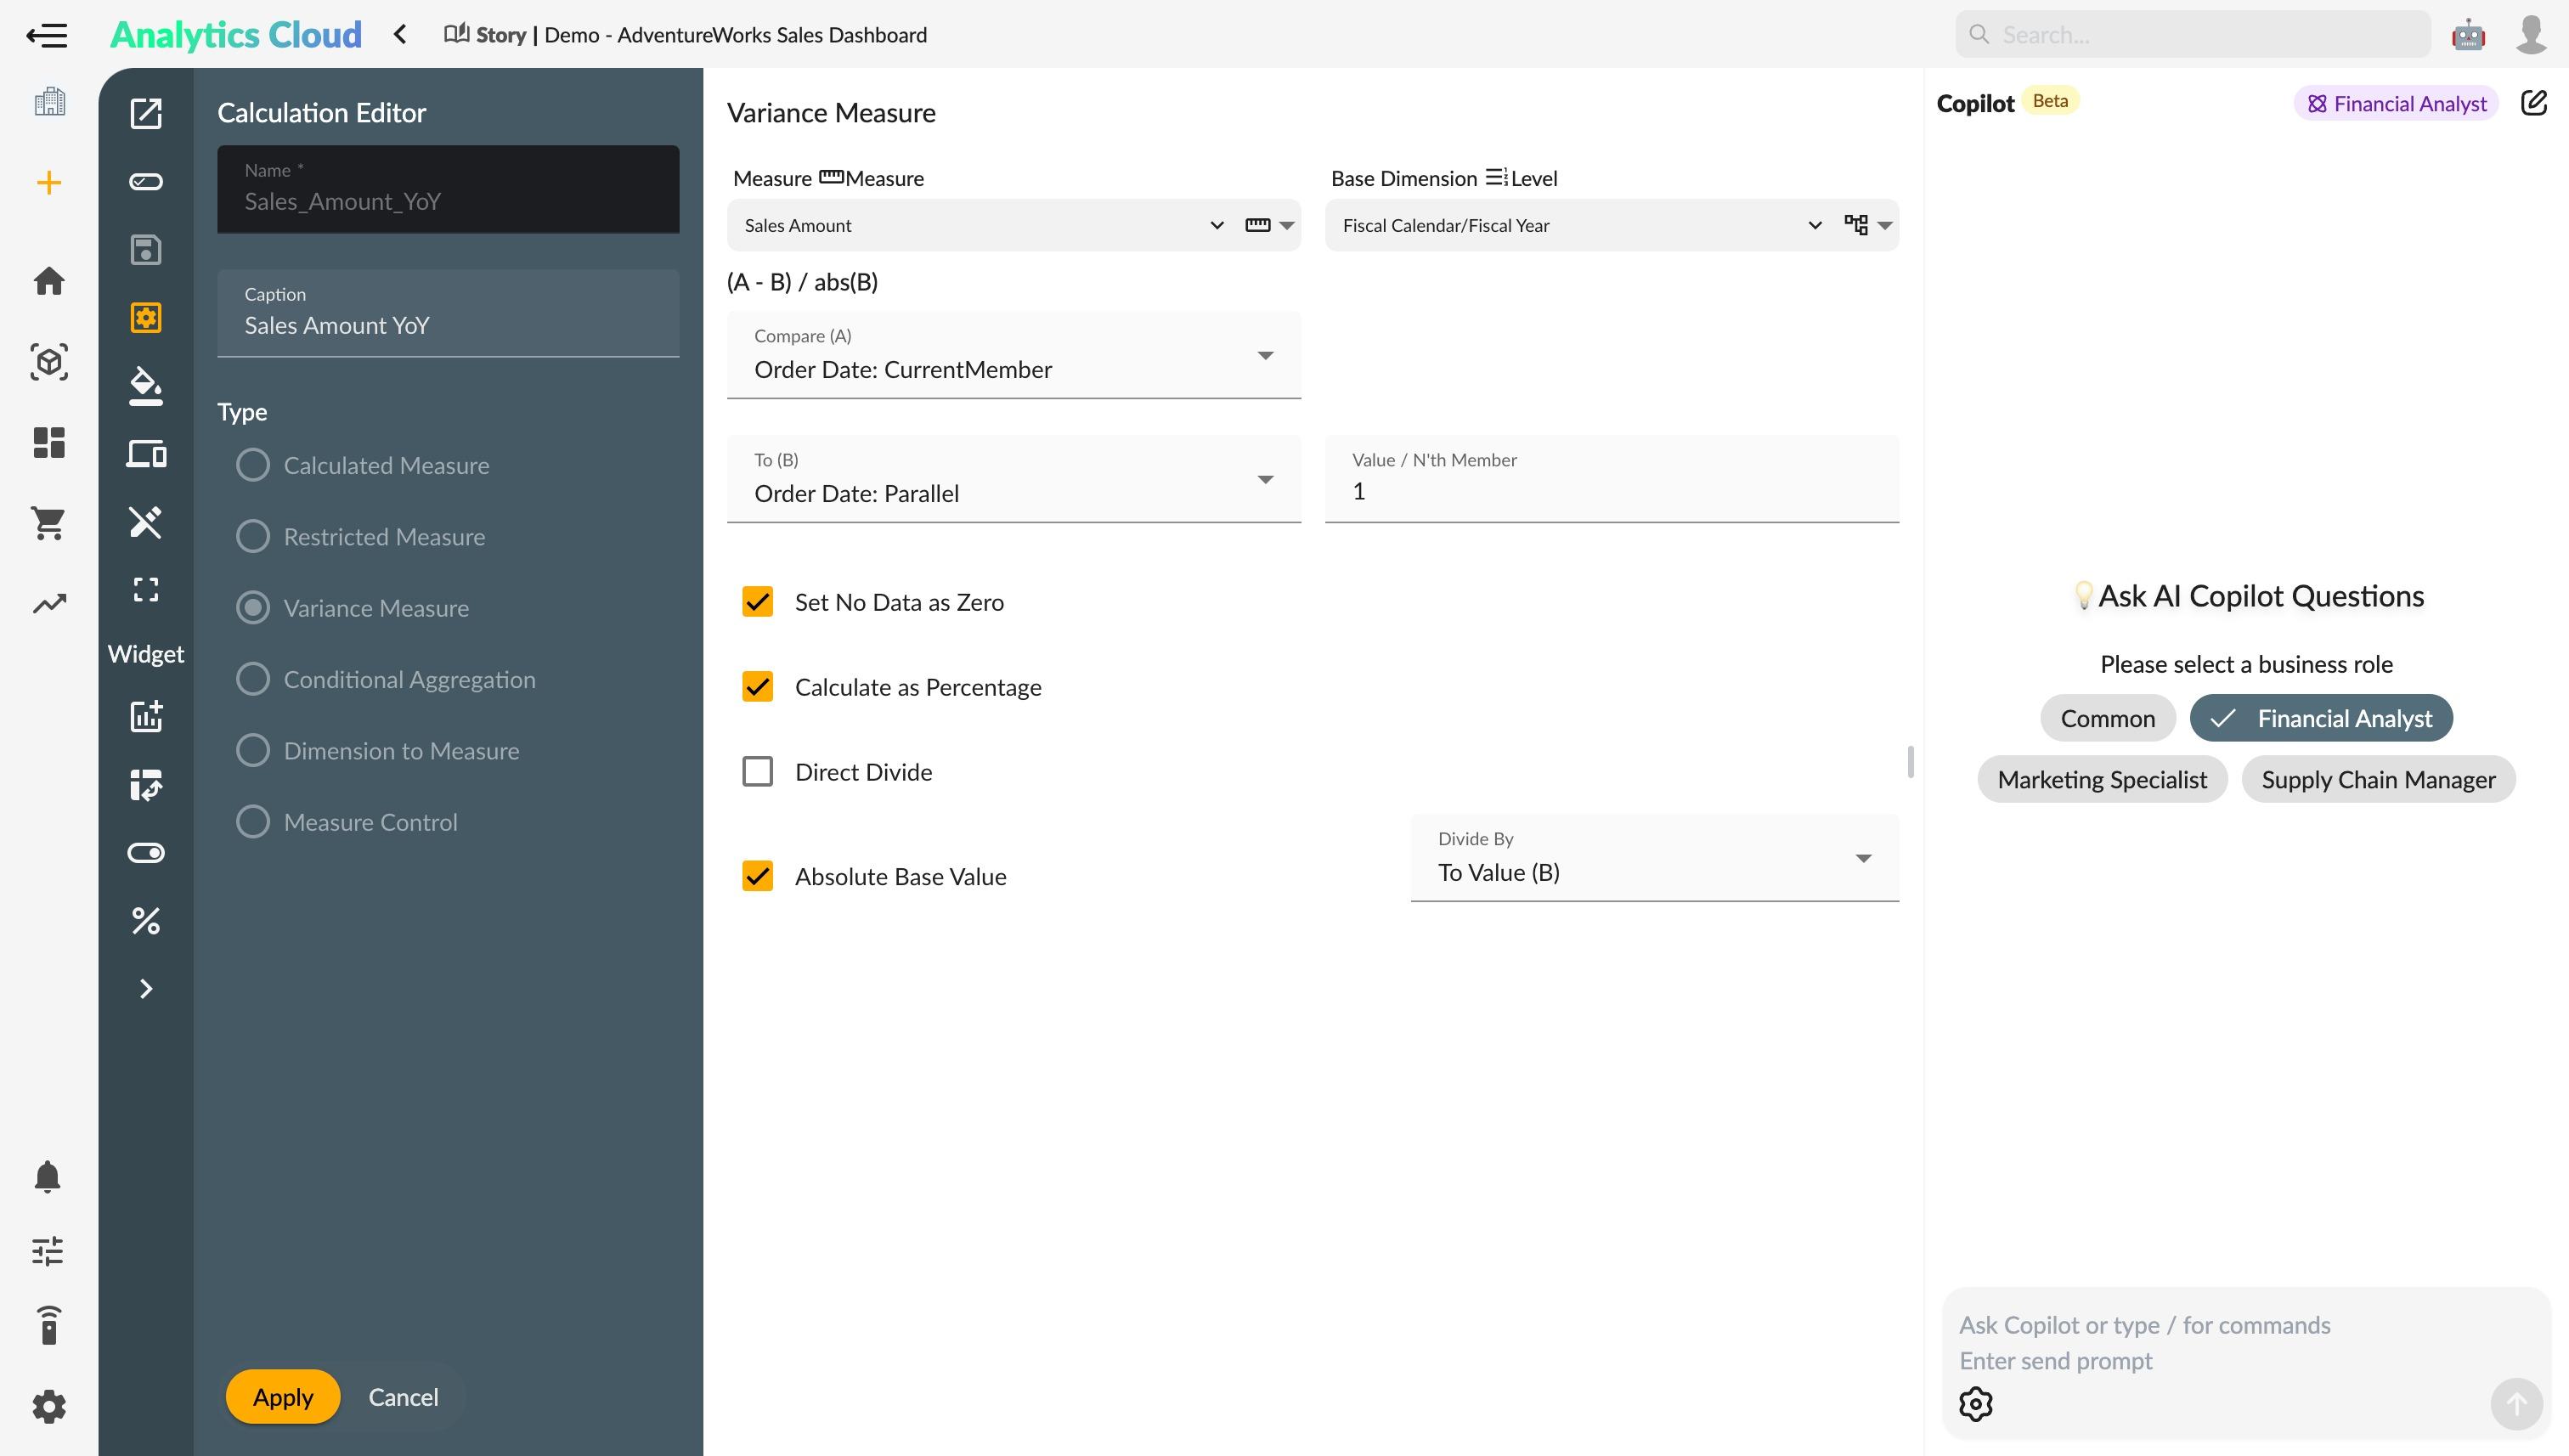
Difference Measure is a type of calculation that measures the difference between one member of a dimension and another. It is commonly used to calculate differences or ratios, such as year-over-year or month-over-month comparisons. The difference can be based on time dimensions or other dimensions like versions.

Time-based comparisons are common, such as calculating year-over-year or month-over-month changes.
- Select the measure fields to compare: You can choose any type of measure, such as regular measures, calculated measures, selected measures, or indicators.
- For time-based comparisons, choose a time dimension as the base dimension.
- To compare differences, use a formula like
A - B. For A, set the condition: It can be the current member or a specific member of the base dimension. - For B, set the condition:
- Current member;
- The member before the current one by N members, where N is a number, such as N=1 for month-over-month difference;
- The member after the current one by N members, where N is a number;
- Parallel member, which is the parallel member of the Nth member before the current one in the base dimension's hierarchy level. Select a
levelfor the base dimension, and set N to a number, like N=1 for year-over-year difference; - Ancestor member, which is the ancestor member of the current one at a specified level in the base dimension, such as calculating the current month's proportion of the total year.
- Calculate as a percentage: This calculates the difference as a percentage. Choose to divide by A or B, expressed as
(A - B) / Aor(A - B) / B. - Direct division: This uses A divided by B, expressed as
A / B. - Absolute base value: This calculates the ratio using the absolute value of the denominator, expressed as
(A - B) / abs(A)or(A - B) / abs(B).
Managing Calculated Measures and Parameters
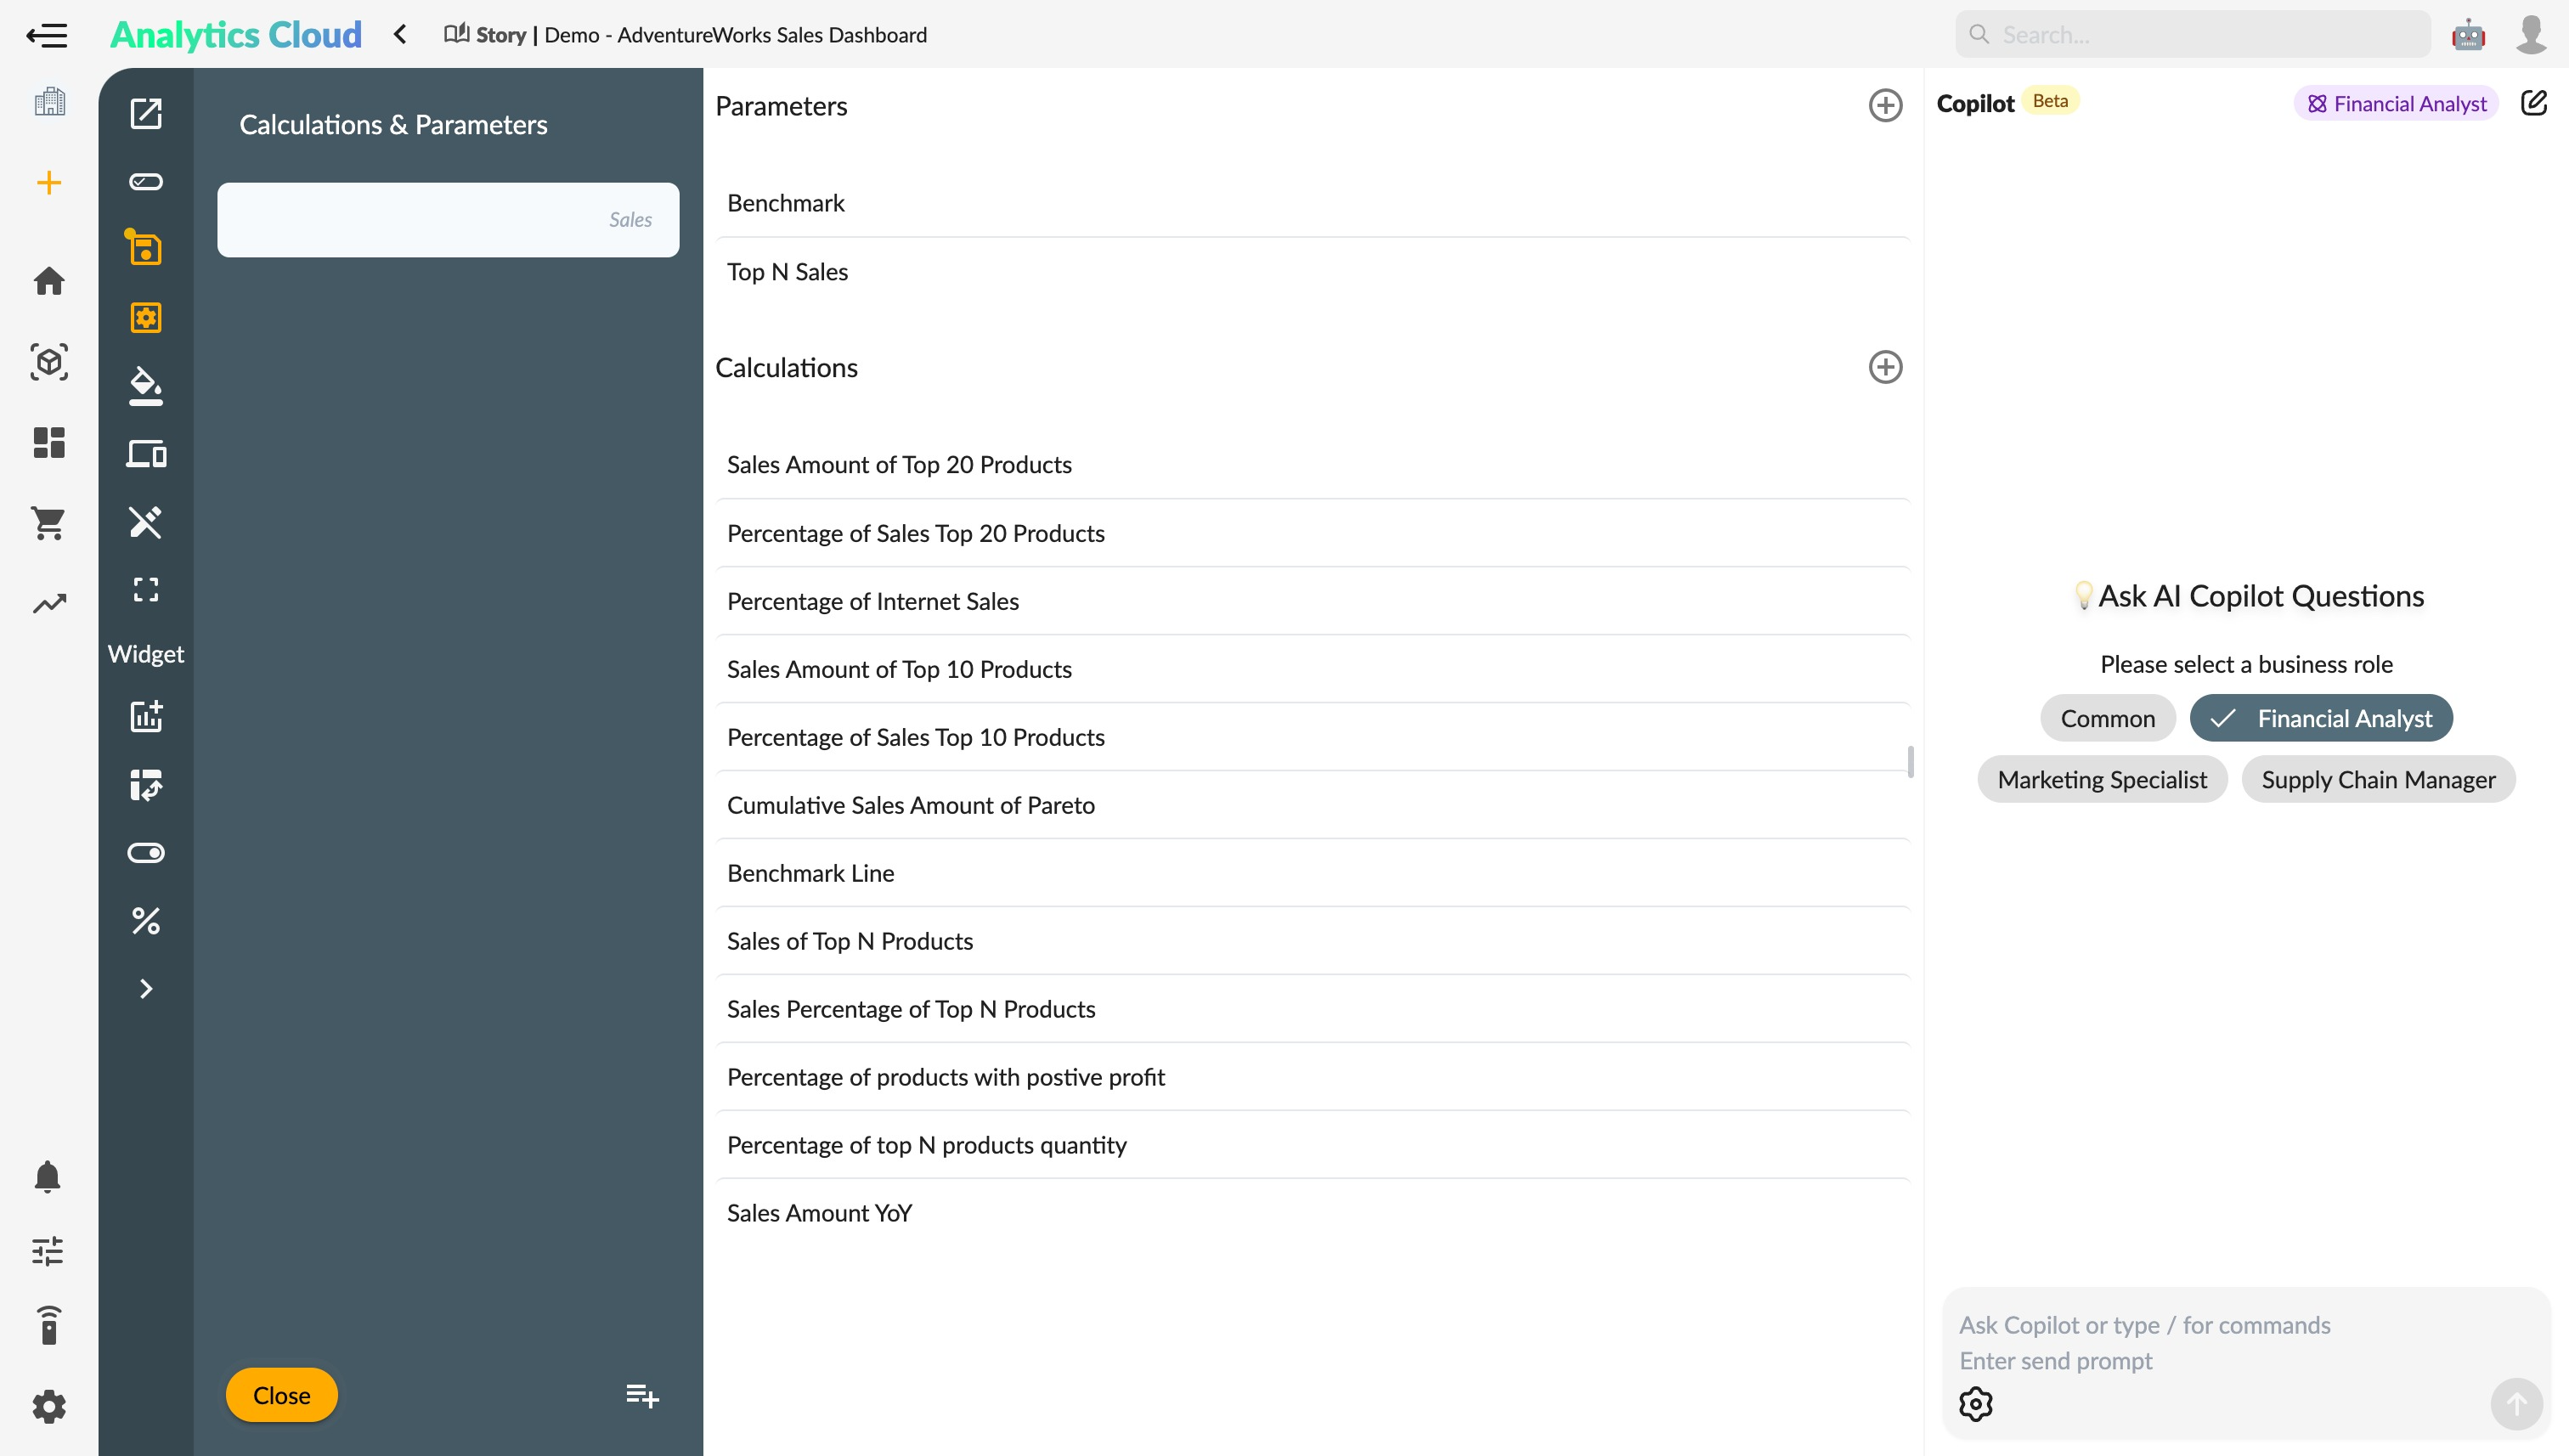
To edit or delete calculated measures and parameters already created in the story, go to the story toolbar menu and select Preferences -> Calculated Members to open the maintenance interface for calculated members and parameters, as shown below:

You can edit, delete, and add calculated members or parameters for multidimensional datasets.
You can also use the AI Copilot calculation command /calculation to create and modify calculated measures.