🧭 Explorer
Explorer of Xpert Analytics Cloud sets a new standard for data exploration, allowing users to understand and experiment with their data in profound ways. The built-in intelligent tools empower you to explore your data for 360° insights, making sense of complex datasets effortlessly.

Start Your Exploration Journey
Unleashing the power of data begins with understanding its intricate relationships. With our data Explorer, you can delve into these relationships and enrich your dataset with calculated measures, hierarchies, and more. You have the freedom to operate on existing semantic models or develop models from third-party data sources. Examples of these sources include SAP BW, S/4HANA, Universe live, acquired connections, amongst others.
Navigation and Access
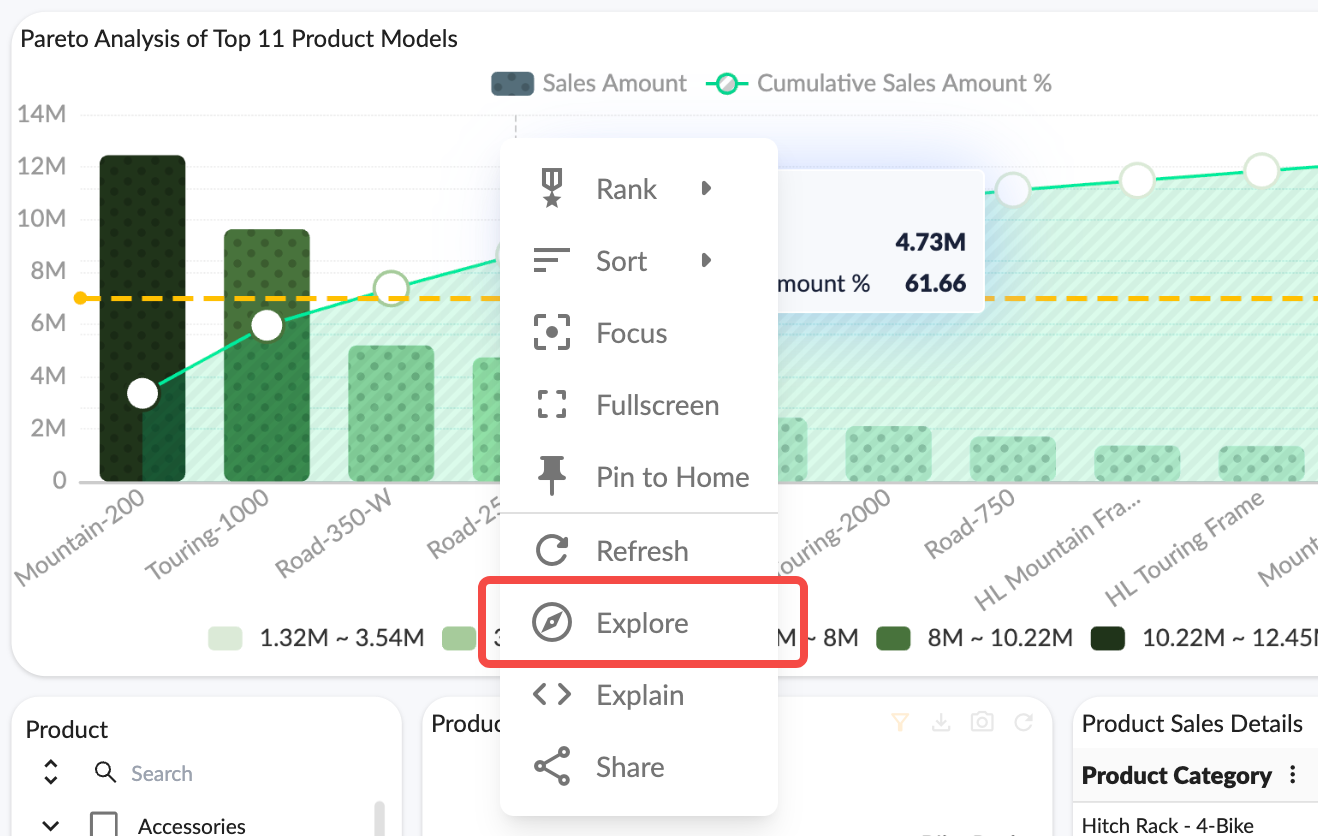
The Explorer emphasizes user-friendly interaction and simplicity. It provides easy-to-use, single-click filtering, sorting, grouping of facets, and renaming of measures and dimensions. Moreover, you can access Explorer Mode via the story widget context menus, or directly from individual charts and widgets, making the exploration process straightforward.
Explore, Analyze, and Understand
The Explorer shares the same UI charting elements with the Story Dashboard. This integration allows for seamless back-and-forth navigation between charts, tables, and Explorer. It's easier than ever to compare data, analyze trends, and understand correlations.
Charting
- Explorer shares same UI charting elements with the Story Dashboard
- Compare, Analyze Trends, Understand Correlations
- Use auto suggest to select the best chart for the data
Visual
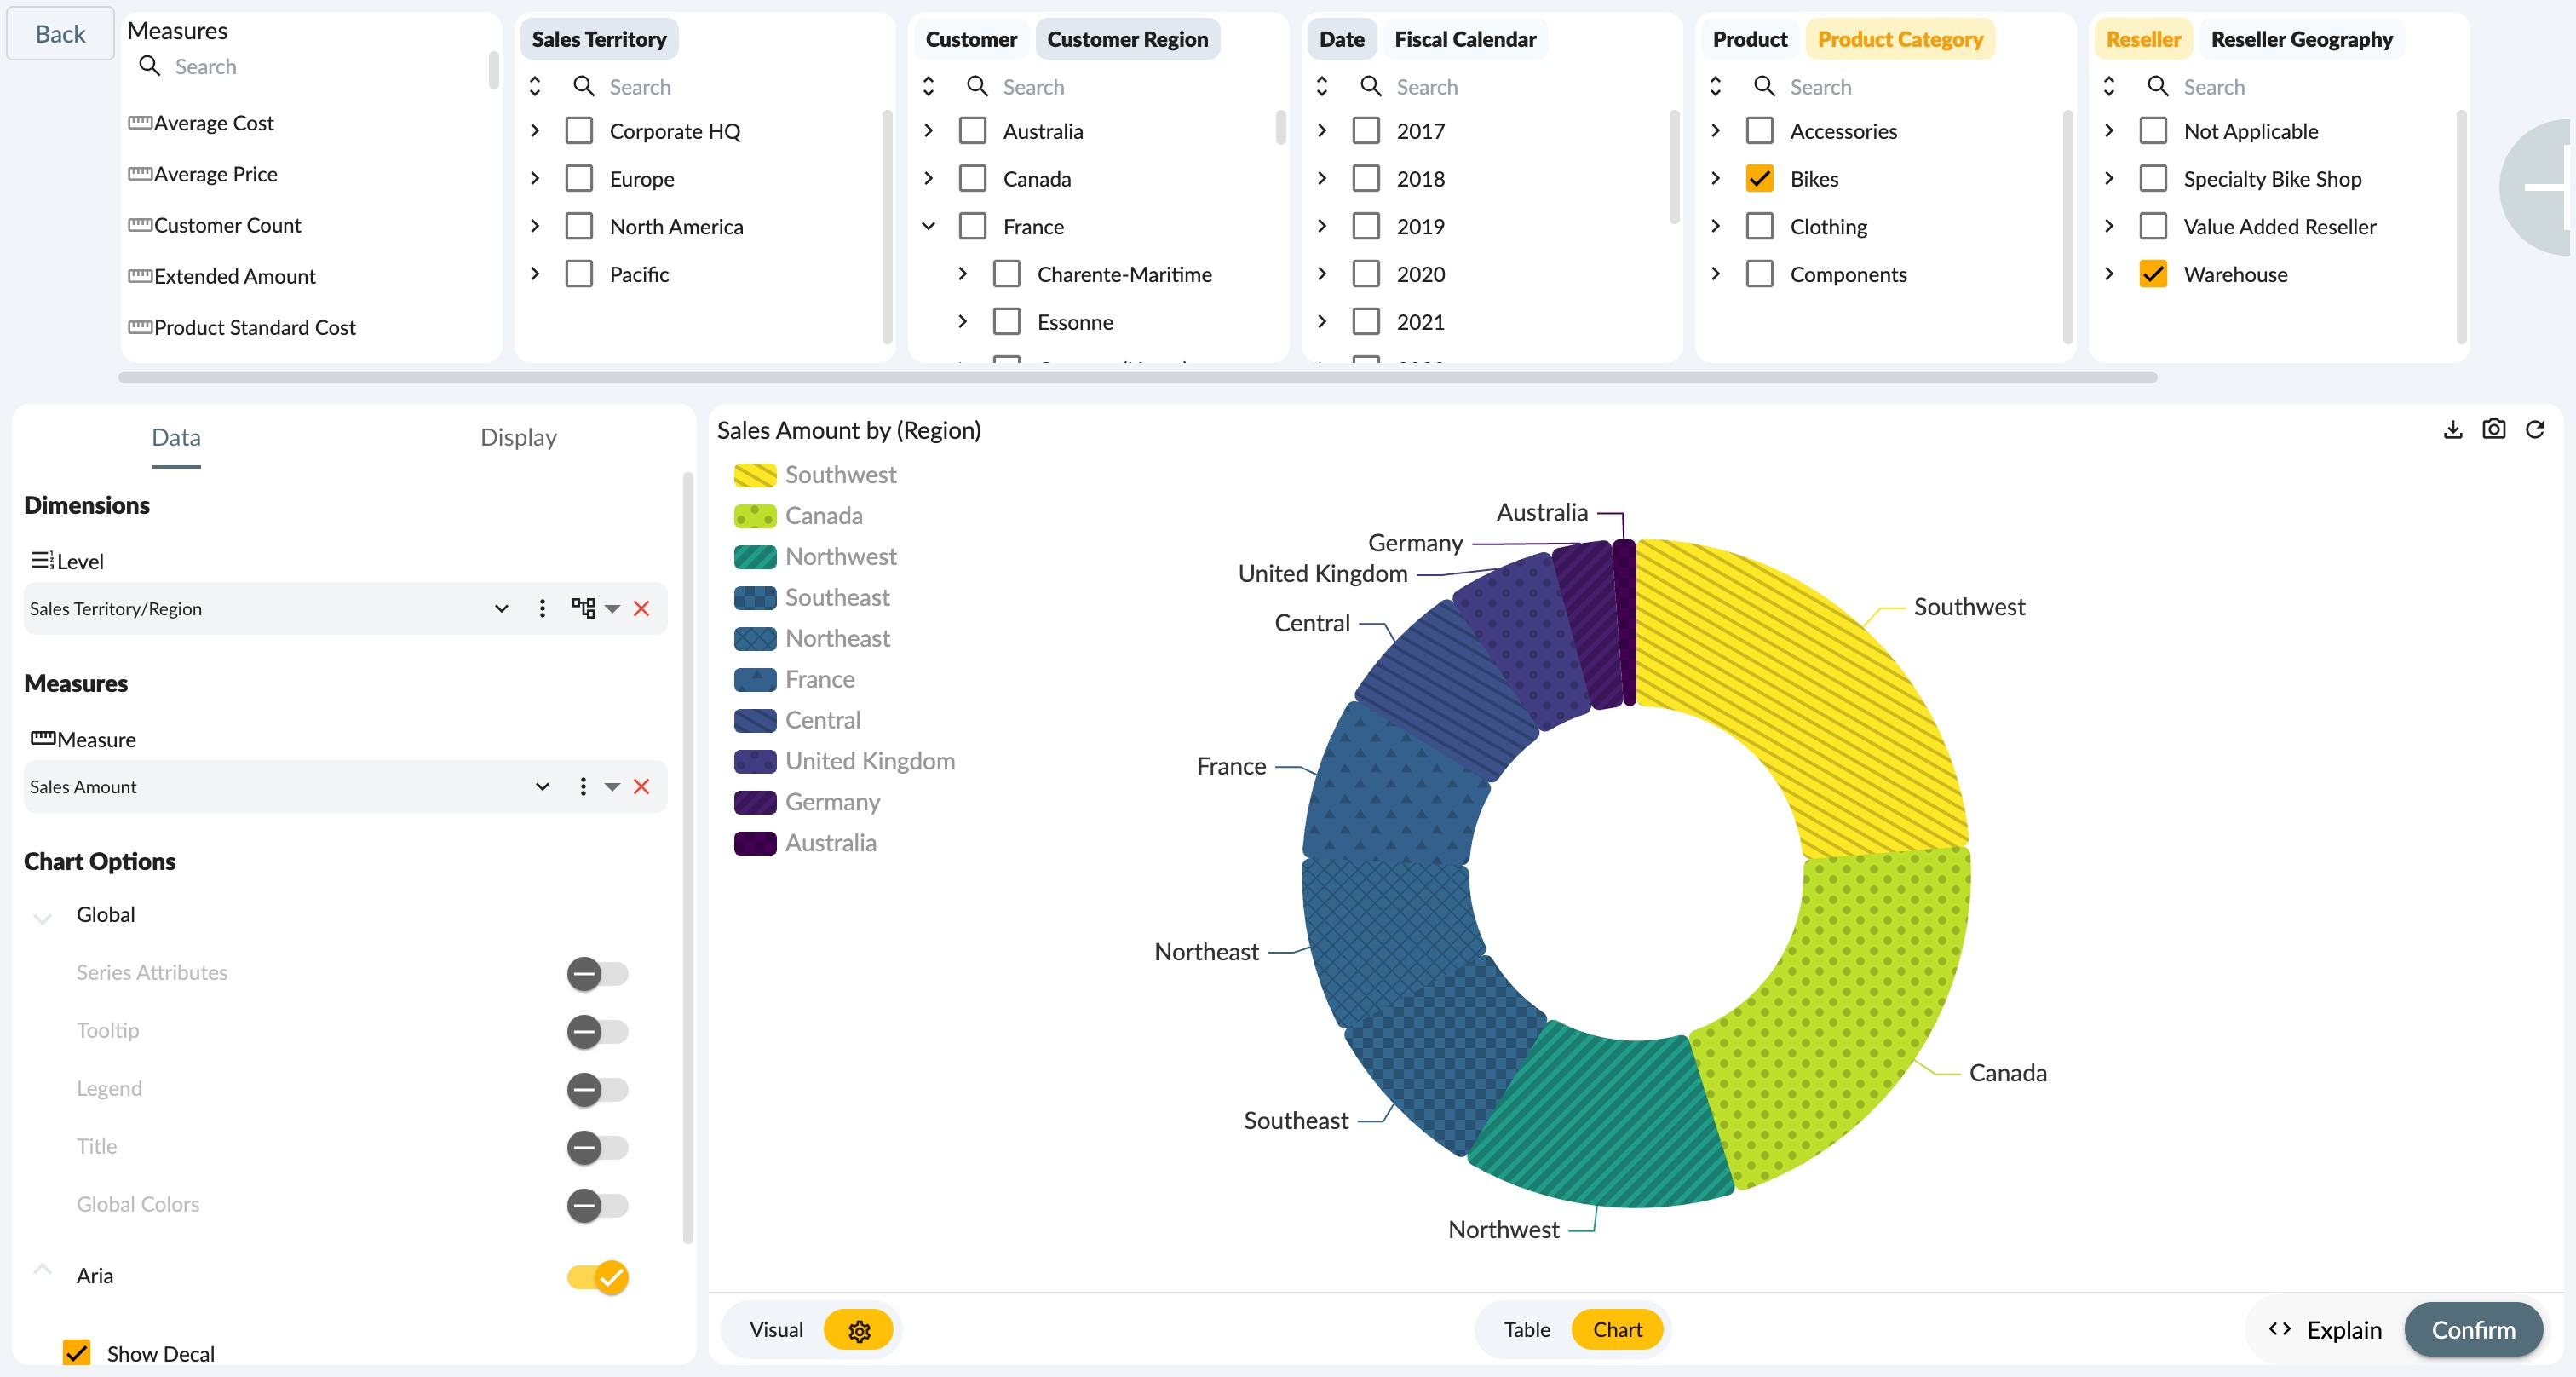
Visual panel in explorer presents a wide array of chart types. The variety ranges from bar charts and line graphs to pie charts, scatter plots, heatmaps and beyond. This diversity allows users to display their information in a way that best suits their dataset and the particular insights they wish to emphasize.
Visual Settings
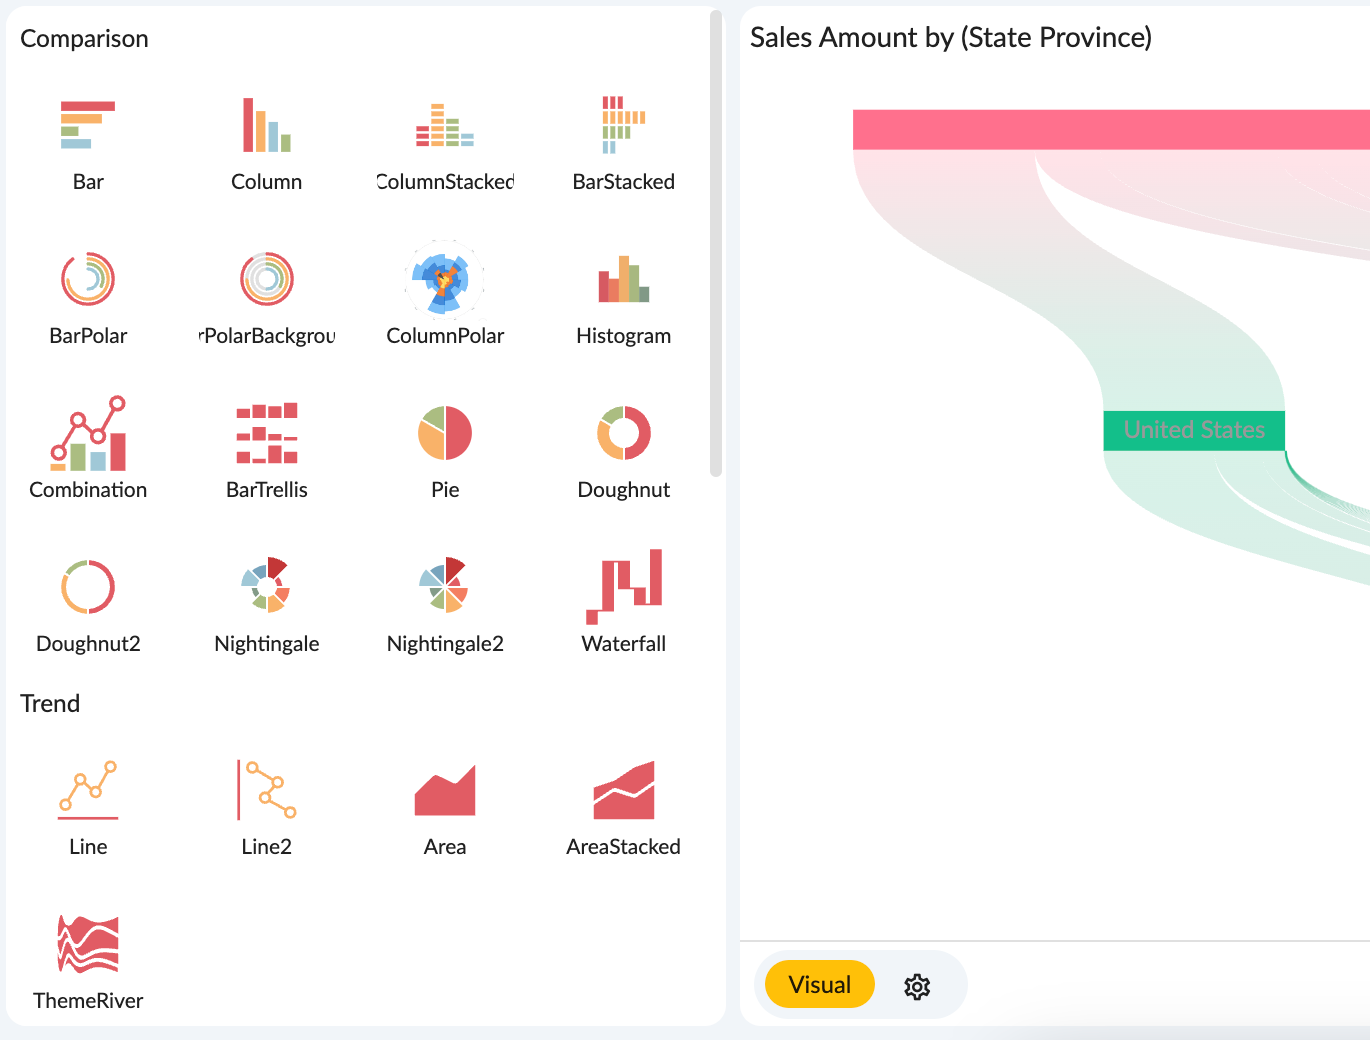
Visual settings panel allowing you to select dimensions and measures, and set the properties of each graphic component and create a visual best-suited to your data.
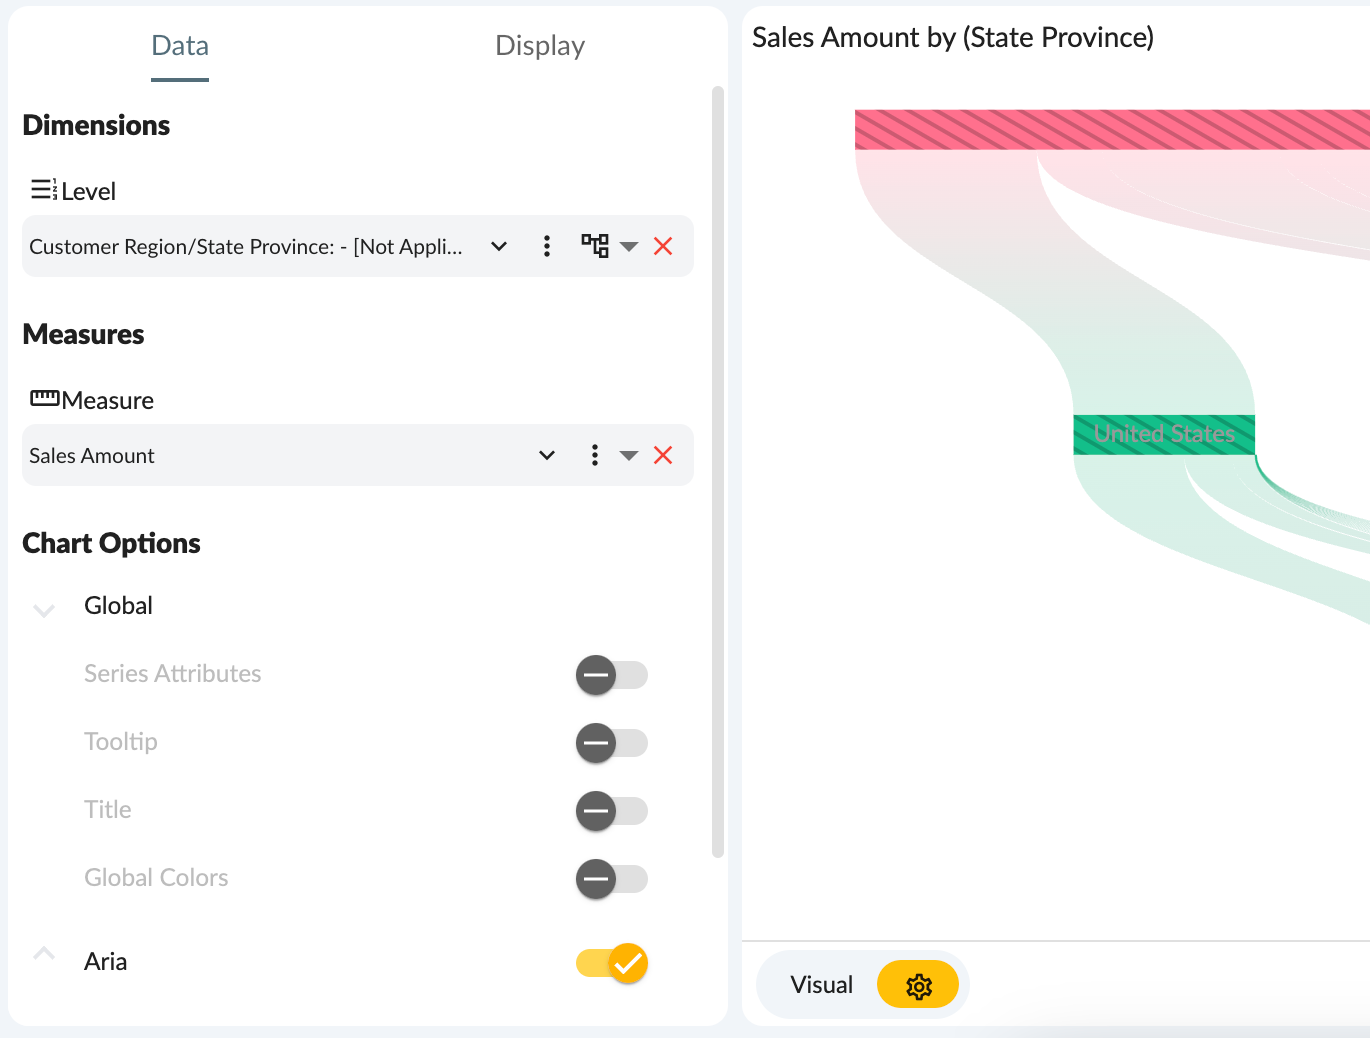
Dimensions define the categories in your data, while measures provide the value for each category - the core building blocks of your visualization. With the Visual Settings panel, you can easily select appropriate dimensions and measures for your visualization, shaping the fundamental structure of your graphic display.
Once your dimensions and measures are set, you can further refine your chart by adjusting the properties of each graphic component. This includes aspects such as color palette, axis properties, legends, series, and more. With this level of minute control, you can ensure that each component of your visualization contributes to a clearly conveyed data narrative.
Explorer provides a comprehensive, intuitive interface for tailoring your data visualization. For detailed settings of the dimensions and measures of charts or tables, please refer to the properties settings of the charts in analytical card and analytical grid widgets in the story.
Table view
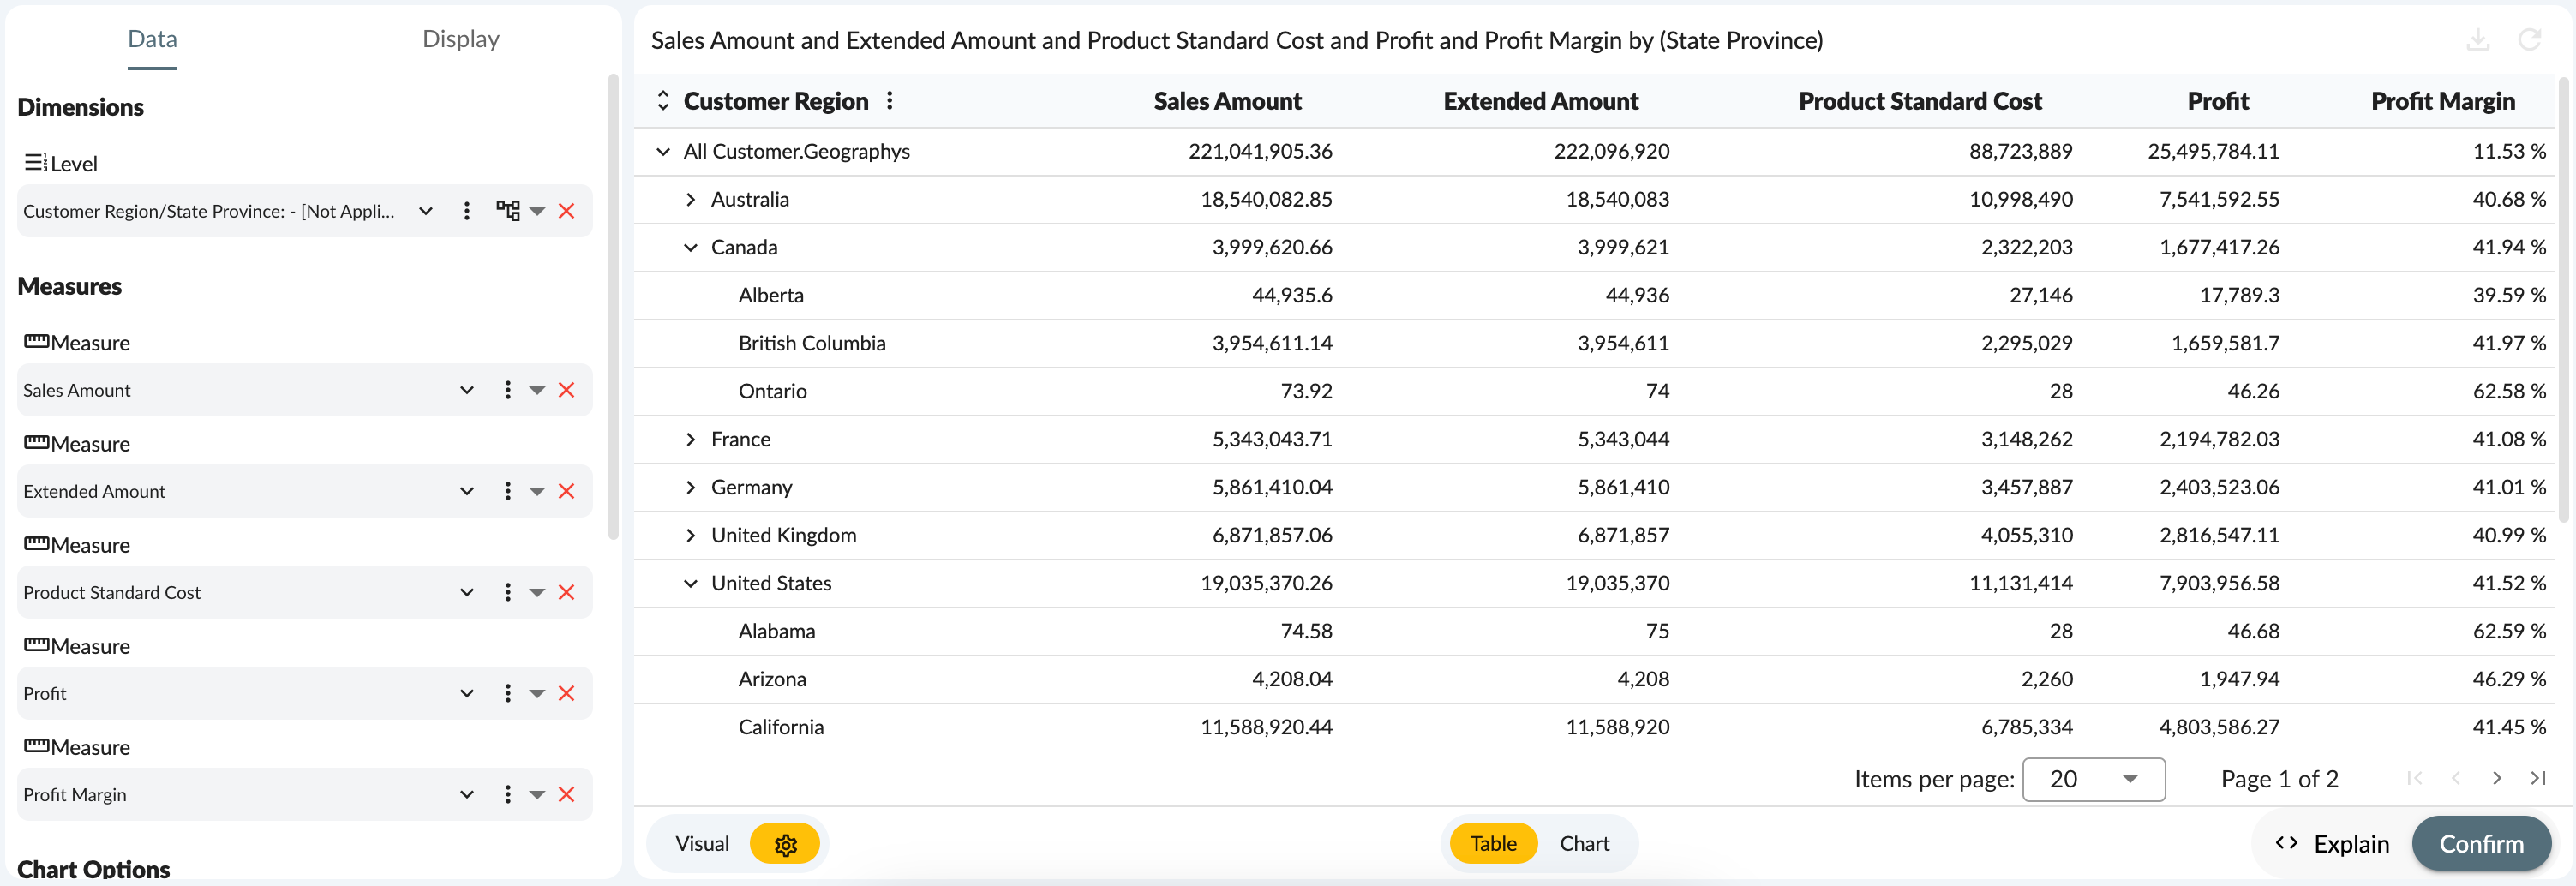
The table view allows you to view the chart data in a tabular format. You can sort, filter, and group the data in the table view. You can also export the data to Excel or CSV format.
Search for the data
An essential part of data analysis is viewing the data in a way that makes sense to you. That's why our data explorer allows you to search members of dimensions to insight data and introduces more dimensions for exploration.

Drag and drop dimensions and their hierarchy into the chart property settings area can be used to create a new chart or modify an existing one.
Explain
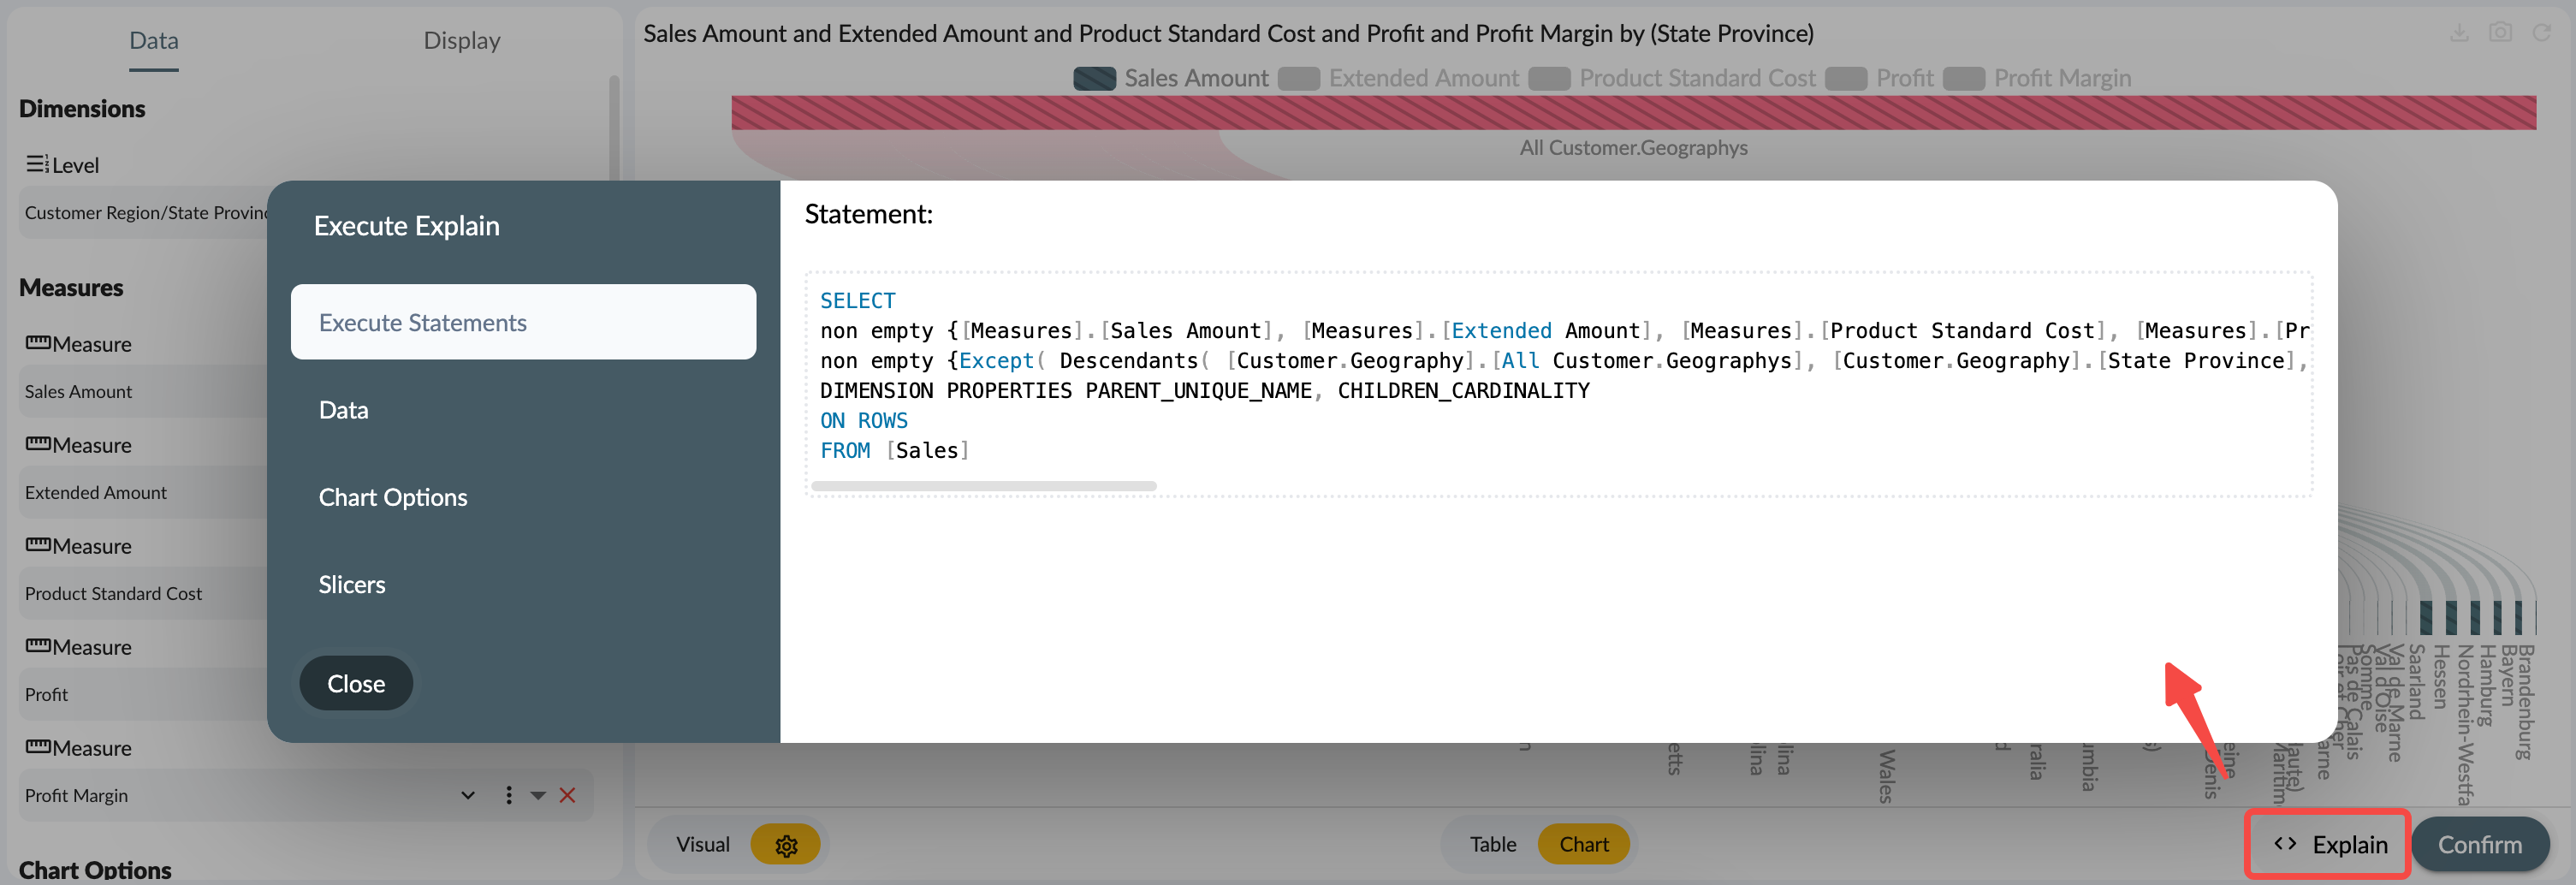
Explain function provides technical analysis of the data query process in the Explorer, covering elements from execution statements, slicers, data, to chart options. It is particularly beneficial for those looking to get under the hood of their analytics and understand the process of transforming raw data into valuable insights.
Apply to Story Widget
With a single click apply, you can apply these exploration results to the story widget to create customized data views that cater to your analytical needs.
Summary
The data Explorer of Xpert Analytics Cloud provides users with comprehensive, guided navigation to data exploration, ensuring a detailed and meaningful analysis every time.