In today's data-driven era, harnessing data for in-depth analysis and insights has become crucial for businesses to gain a competitive advantage. Power BI is a widely popular business intelligence tool, while Xpert Analytics Cloud serves as a powerful data analysis platform that offers comparable modeling capabilities to Power BI. This article will explore how to leverage the semantic modeling capabilities of Xpert Analytics Cloud to achieve similar functionalities as Power BI, using the AdventureWorks Sales dataset for demonstration purposes.
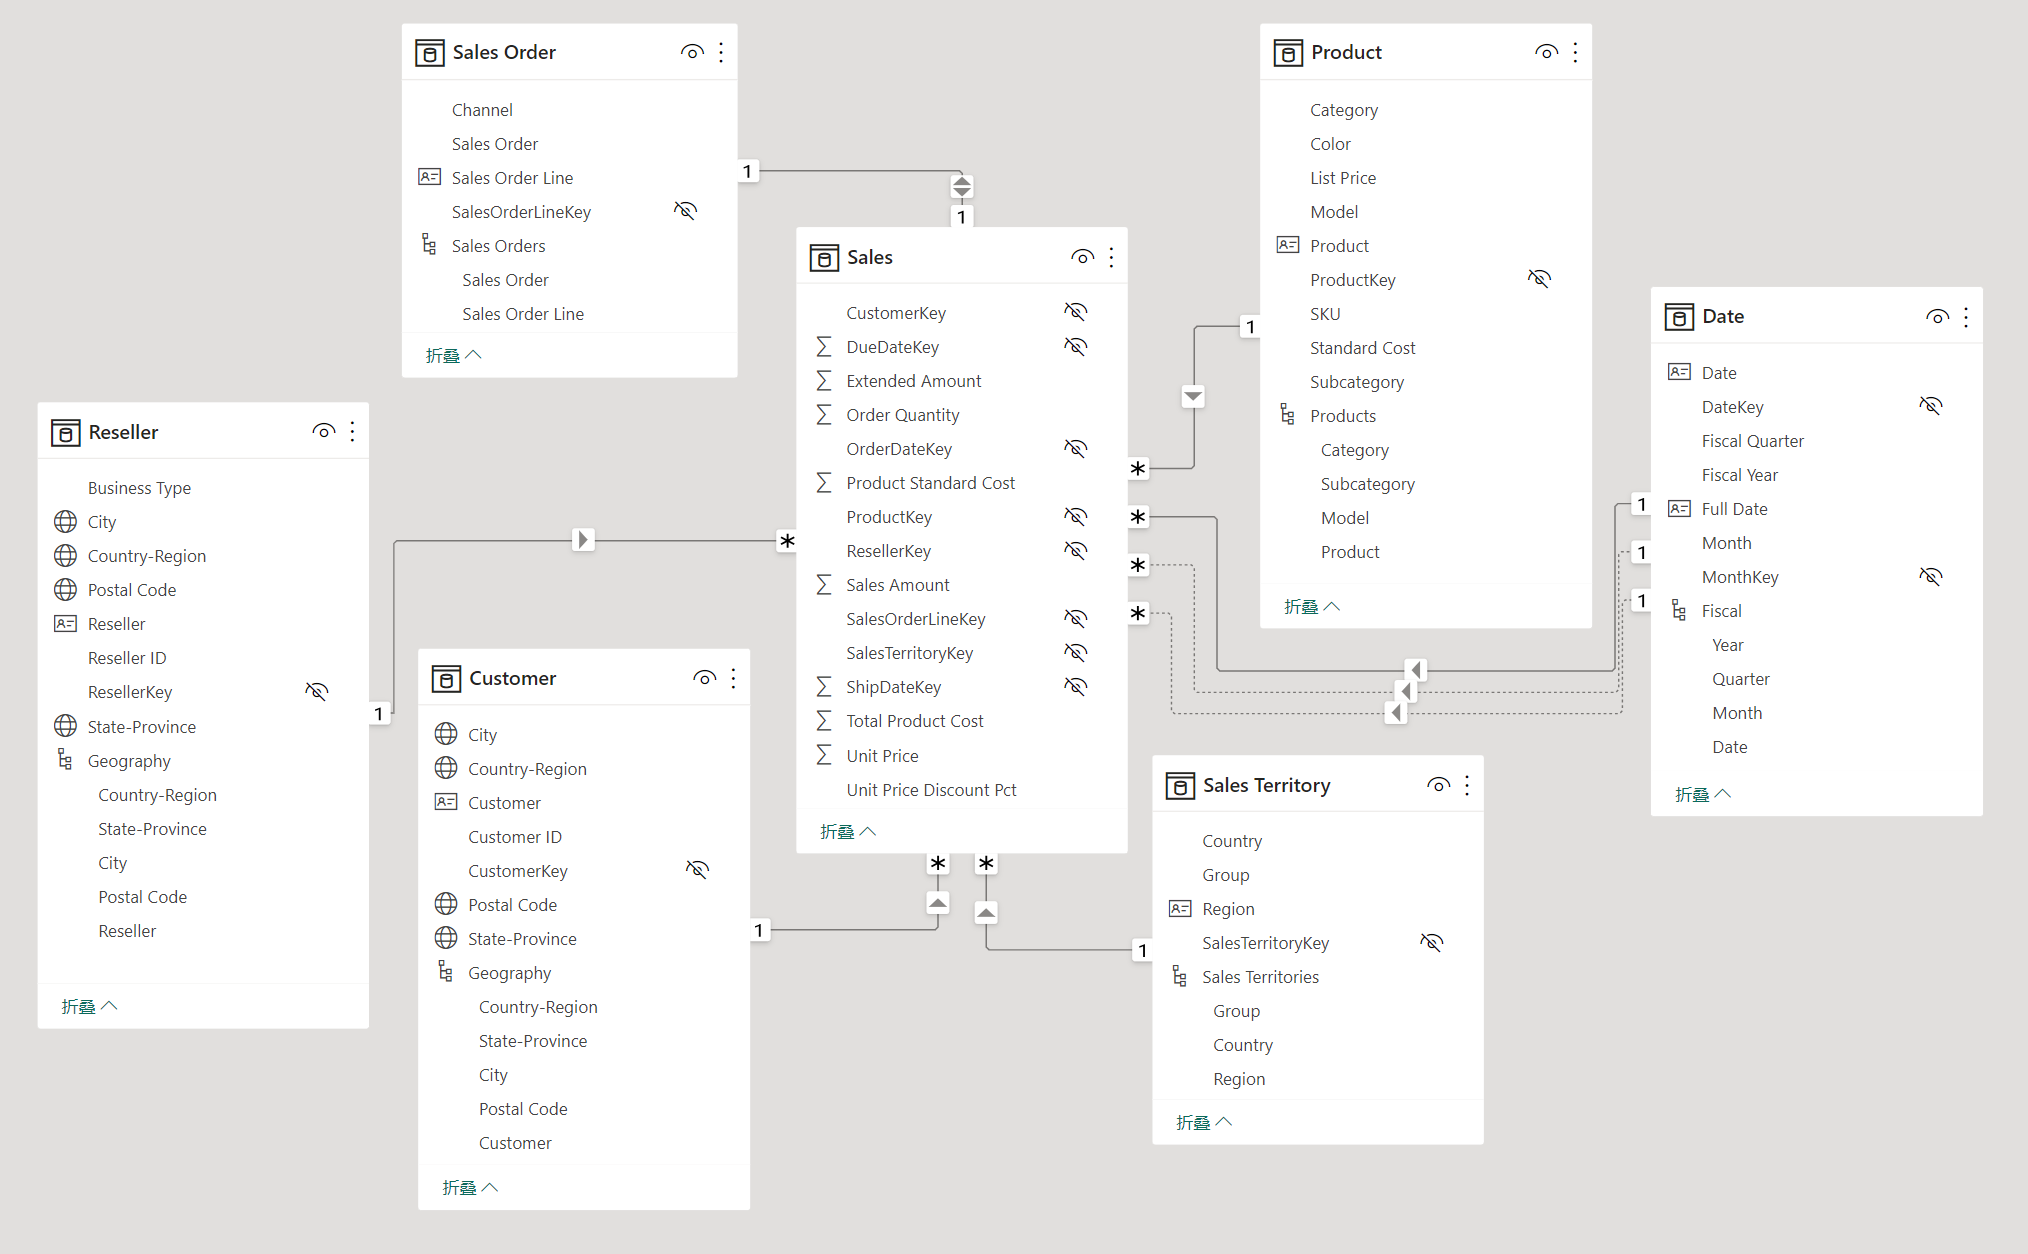
Below is the data relationship model of the AdventureWorks Sales dataset in Power BI:
Sample dataset
AdventureWorks Sales in the Power BI Samples dataset is a commonly used example dataset that showcases the data modeling and visualization capabilities of Power BI. The AdventureWorks Sales dataset simulates a sales business scenario and consists of multiple tables, as follows:
Customer: Contains information about customers, such as Customer ID, name, address, etc. This table is used to track and analyze the sales performance of different customers, including their purchase history and geographical distribution.
Date: Records dates and related information such as year, quarter, month, etc. This table can be used for time-based analysis, such as trend analysis and comparisons of sales data on an annual, quarterly, or monthly basis.
Product: Describes the products offered by the company, including Product ID, name, description, etc. This table is used to analyze the sales performance of different products, such as best-selling products and product category distribution.
Reseller: Records detailed information about resellers, such as Reseller ID, name, address, etc. This table is used to analyze the sales performance and market share of different resellers.
Sales: Contains information about sales transactions, such as Sales ID, sales date, sales amount, etc. This table is the core of the AdventureWorks Sales dataset and is used to analyze various aspects of the sales business, such as sales revenue, sales trends, sales by region, etc.
Sales Order: Records detailed information about sales orders, such as Order ID, Customer ID, Product ID, etc. This table is used to track and analyze the status, volume, and cycle of sales orders.
Sales Territory: Describes detailed information about sales territories, such as Territory ID, name, country/region, etc. This table is used to analyze the sales performance and market share of different territories.
To download the AdventureWorks Sales dataset, please refer to powerbi-desktop-samples/AdventureWorks Sales Sample.
In this article, we will demonstrate how to create appropriate relationships in the data model, define dimensions and measures, and leverage the visualization capabilities of Xpert Analytics Cloud to showcase and explore the AdventureWorks Sales dataset. Users can analyze sales data by creating interactive reports, dashboards, and charts to discover trends, patterns, and correlations, gaining valuable insights and decision support similar to using Power BI.
Create Semantic Model
Before creating the semantic model, let's assume that we have already imported the AdventureWorks Sales data into the database, and all the tables are prefixed with adv_.
Xpert Analytics Cloud individual users can utilize the built-in data source called "Demo - PG DB" and access the data tables with a prefix of adv_ located in the public schema.
To create a semantic model for the AdventureWorks Sales dataset, select Use MDX Modeling:
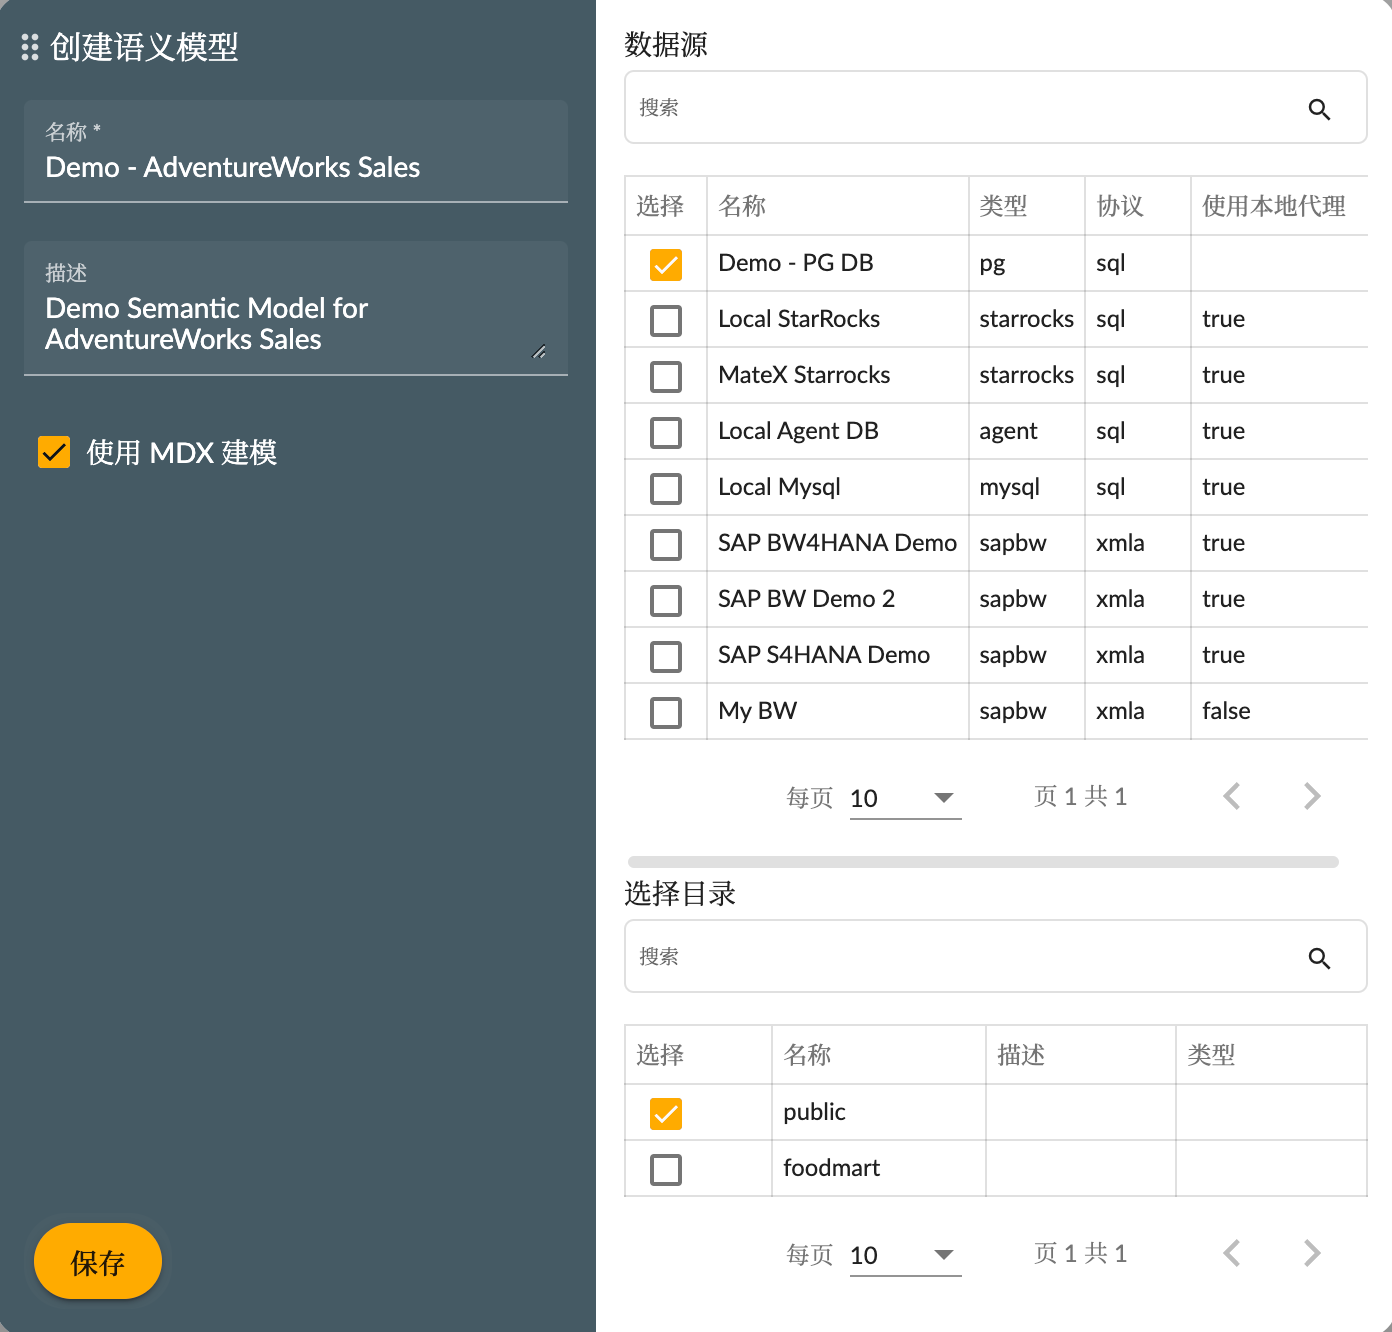
Once the creation is successful, open the workspace of this semantic model.
Create Dimensions
We need to create dimensions first. Dimensions are used to describe the attributes of facts, such as products, customers, time, etc. In the AdventureWorks Sales dataset, we can create dimensions from data tables like adv_product, adv_customer, and adv_date.
Let's take creating the Reseller dimension as an example. In the diagram below, you can drag and drop the physical table adv_reseller into the entity area, and it will prompt a dialog box to create the dimension. Select the type as Dimension, provide a name and label for the dimension, and on the right-hand side, set a field as the dimension's Key and choose the default Visible field. Click the Apply button to create the dimension.
After opening the Dimension Designer page, you can make detailed modifications to the structure and properties of the dimension. For example, in the screenshot below, you can modify the Business Type hierarchy attribute of the Reseller dimension. Change the name to Business Type, update the text label to 业务类型 (which means "Business Type" in Chinese), and select Member Uniqued.
To modify the attributes of the Reseller hierarchy and set its Caption Field to reseller, indicating that the technical ID of the hierarchy members is based on the value of the reseller_id field, while the display text name is based on the value of the reseller field. Setting the hierarchy attribute as Member Unique based on the actual scenario is beneficial for optimizing query performance in OLAP engines.
Create Hierarchy
The Reseller dimension created above is just the default hierarchy. We can create multiple hierarchies for it, such as creating a hierarchy based on the geographic information of reseller regions. As shown in the screenshot below, click the "Add Hierarchy" button to create a new hierarchy. Drag and drop the appropriate data table into the dimension table area, and in the hierarchy properties, set the hierarchy name, label, and primary key:
To add a hierarchy, as shown in the screenshot below, drag and drop the reseller region fields (country_region, state_province, city, postal_code) into the hierarchy area. Then, configure the detailed properties of the hierarchy, which will not be elaborated here.
In the data preview area of the dimension, we can see the detailed data of dimension members displayed in hierarchical order.
The creation process for other dimensions such as Customer, Date, Product, Sales Order, and Sales Territory is similar, and it will not be elaborated here.
Create Cube
Next, we will create a multidimensional dataset using the fact table adv_sales. As shown in the screenshot below, drag and drop the adv_sales table into the entity area, and it will prompt a dialog box to create a multidimensional dataset. Select the type as Cube, provide a name and label for the dataset, and on the right-hand side, configure the measurement fields and associate the dimension fields with the shared dimensions. Click the Apply button to create the multidimensional dataset.
Open the designer interface of the Sales cube entity, as shown in the screenshot below. We can see the structure of the cube entity, including dimensions, measures, and calculated members. In the cube entity designer, we can make detailed modifications to the structure and properties of the cube entity.
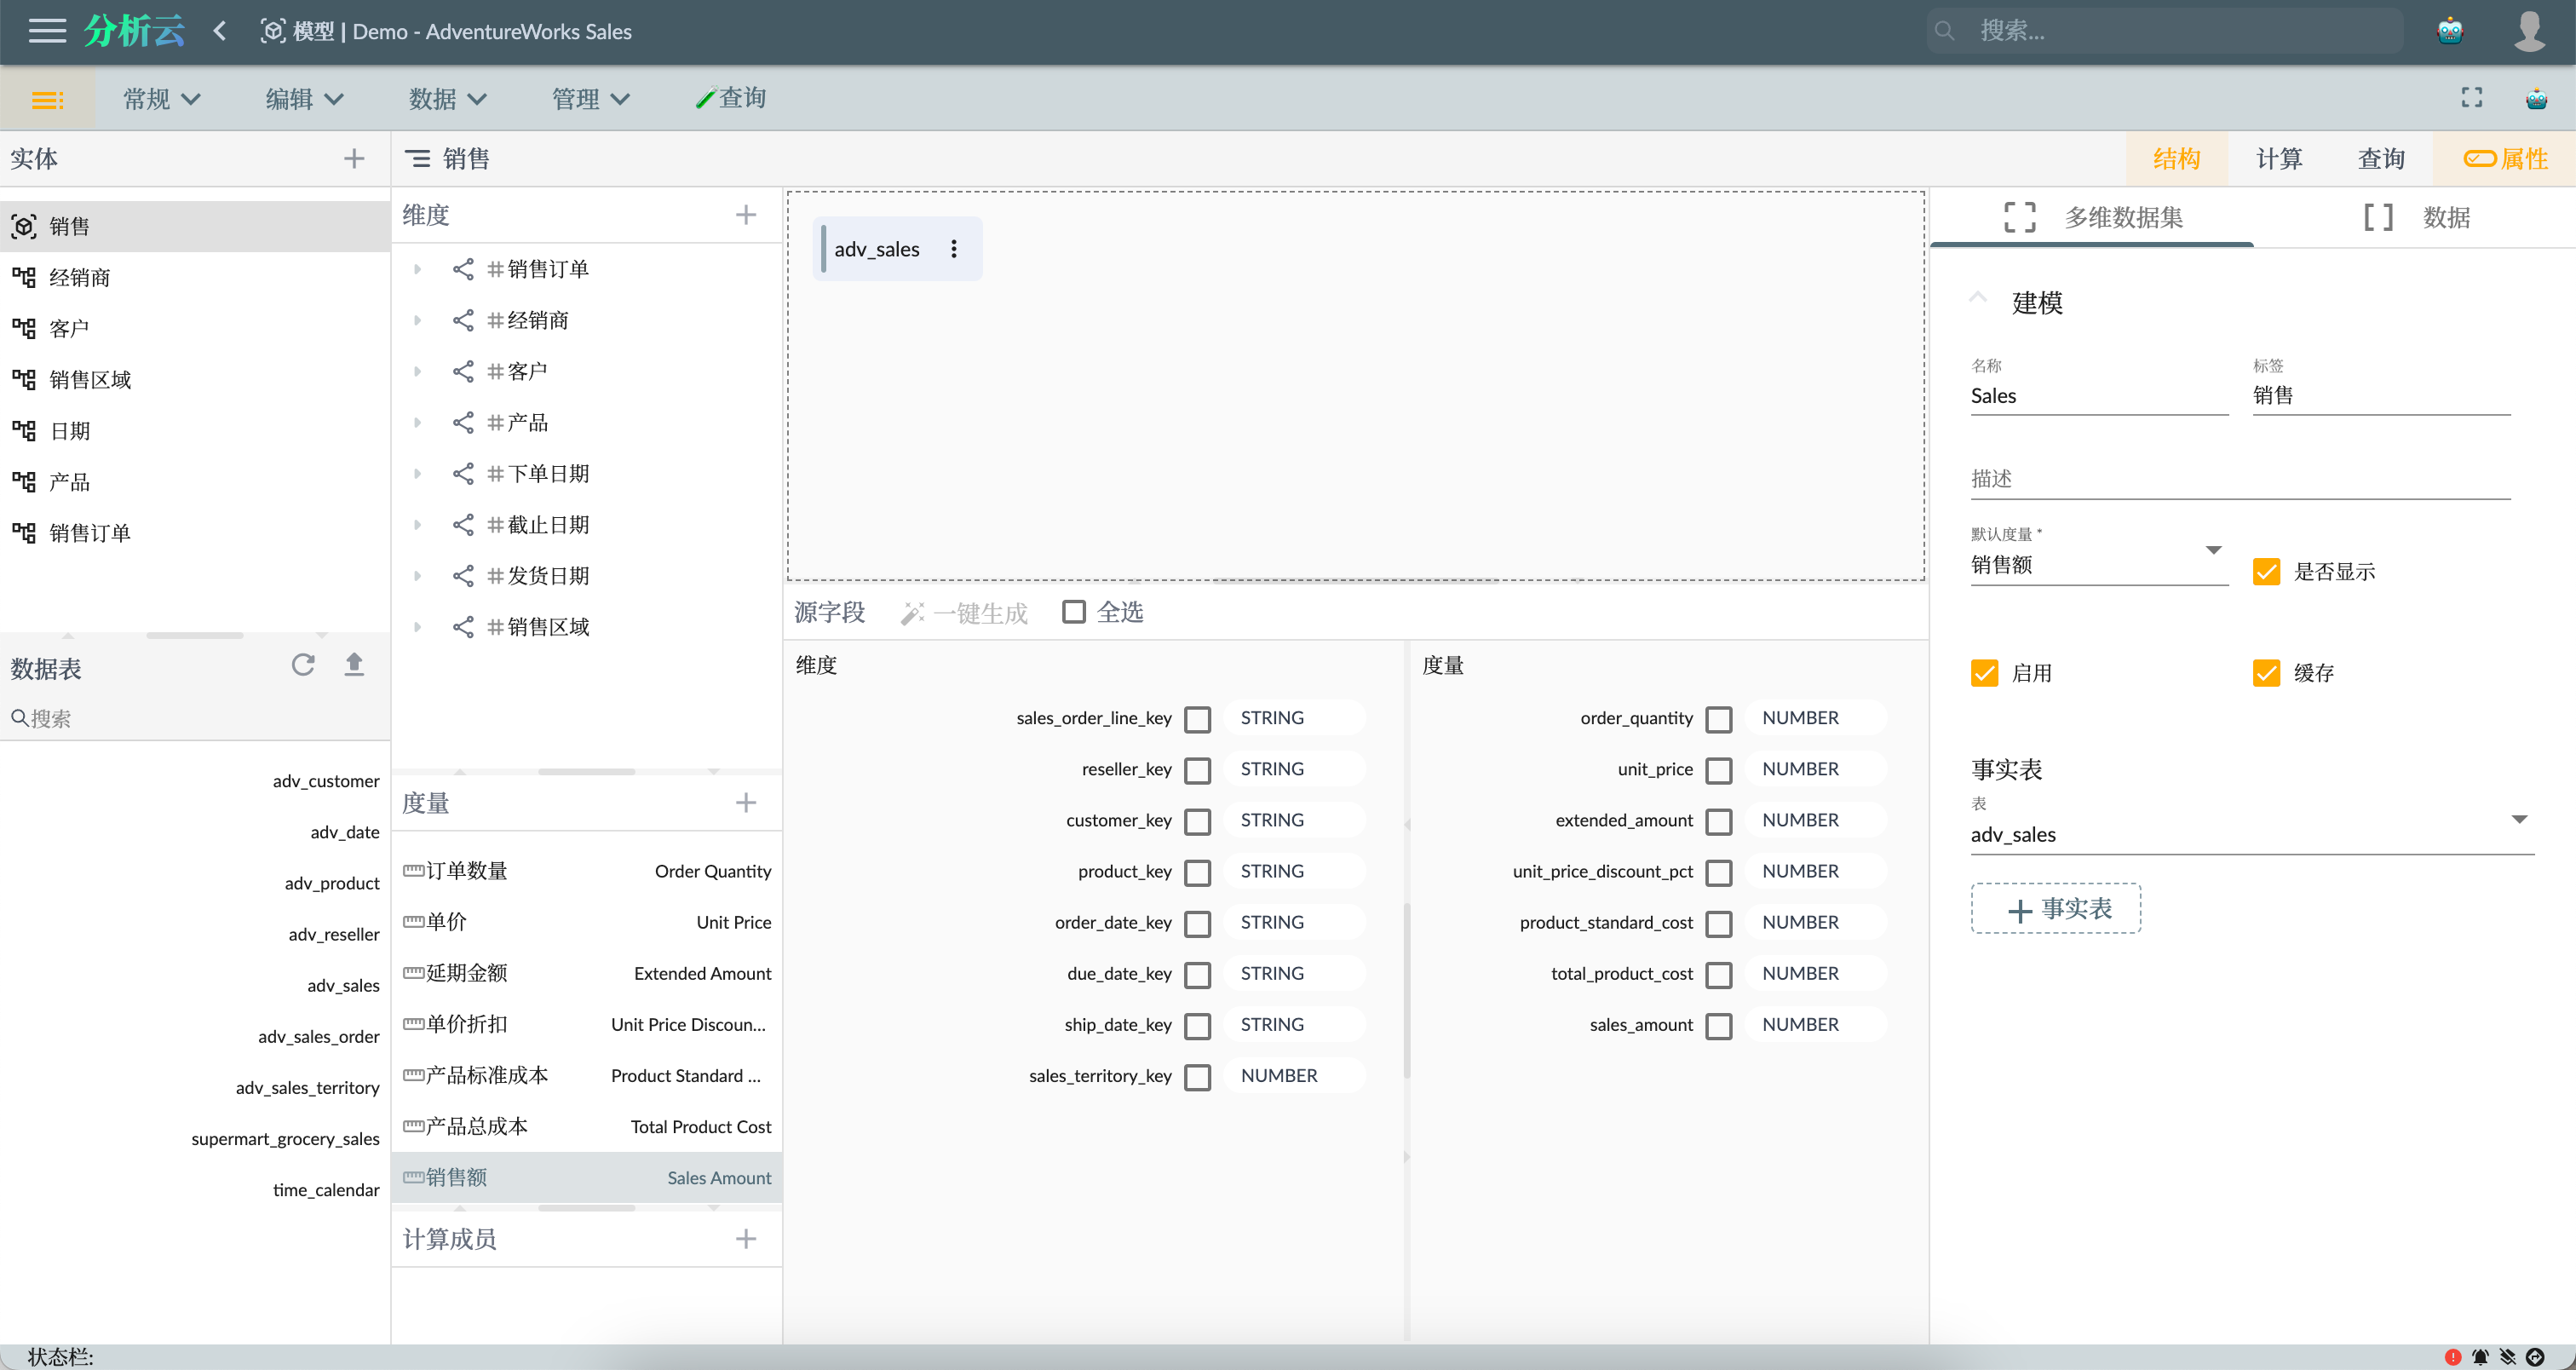
- Set default measures for the cube entity.
- Modify the names and captions of the cube entity and measures.
Many-to-One Dimension
For the Date dimension, there are multiple dimensions on the Sales cube entity that will be associated with this dimension, such as Order Date, Dube Date, and Ship Date. Therefore, we need to set different names for the relationships that share the same dimension.
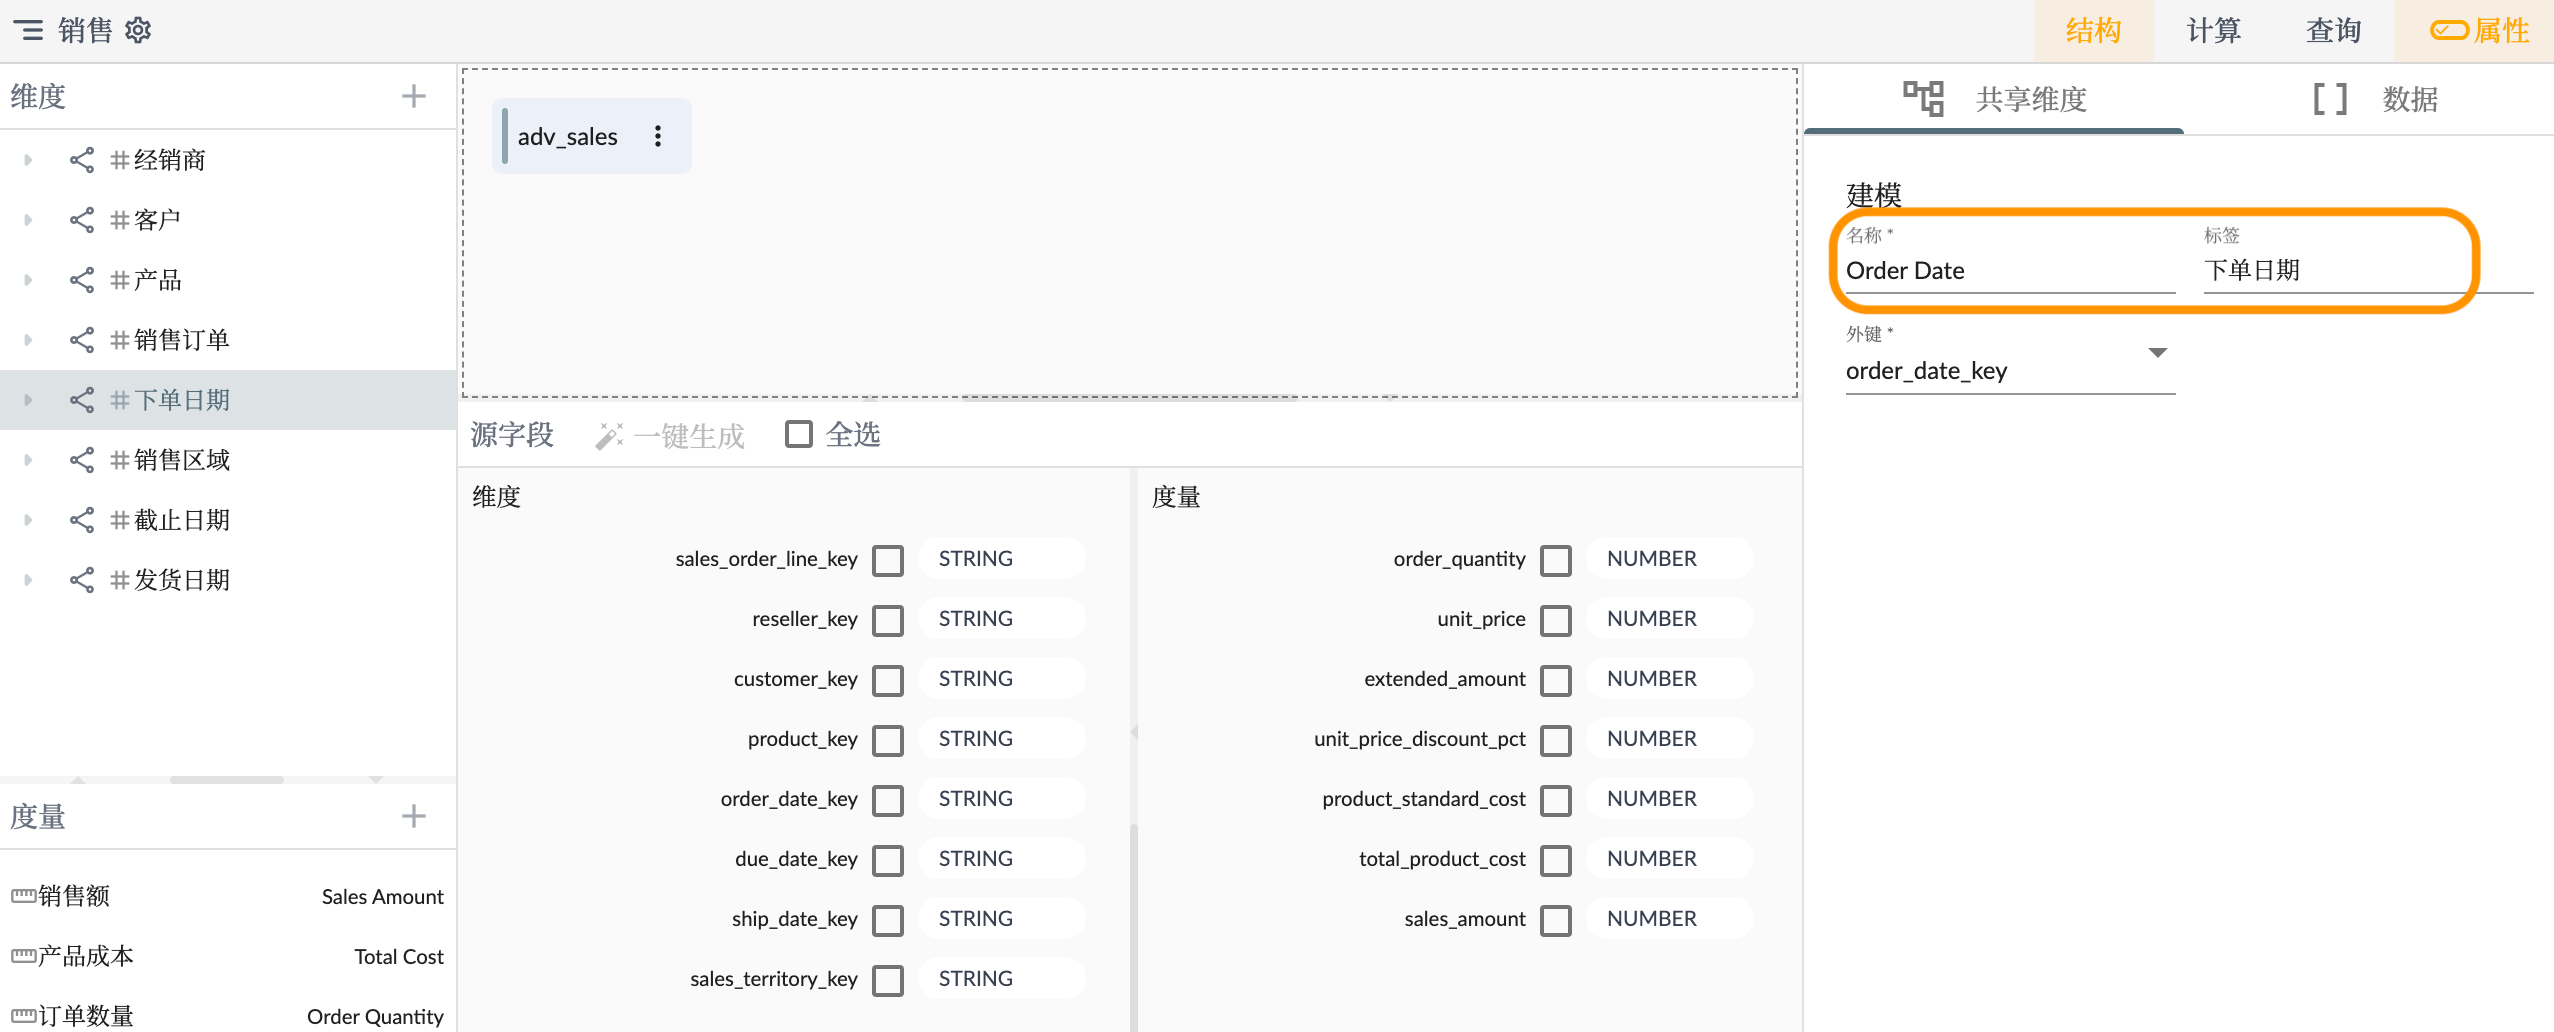
The dimension names will be modified as follows:
- Order Date for the dimension associated with the order date.
- Due Date for the dimension associated with the deadline date.
- Ship Date for the dimension associated with the shipping date.
By assigning these distinct names to the dimensions, they will no longer have duplicate names due to sharing a common dimension.
Calculated Members
In the semantic model, Calculated Members are user-defined virtual members generated based on existing data and calculation logic. Calculated Members allow users to perform custom calculations and aggregations in the data model, providing richer and more flexible analysis and insights.
Here is some important information about Calculated Members in the semantic model:
Definition and creation: Calculated Members can be defined and created in the semantic model using formulas or expressions. Users can use MDX (Multidimensional Expressions) query language to write the logic for calculated members. These expressions can include mathematical operations, conditional statements, function calls, etc., to calculate and derive new data as needed.
Scope of application: Calculated Members can be applied at both the dimension and measure levels. At the dimension level, calculated members can add new categories, hierarchies, or level members to the dimension. At the measure level, calculated members can be used to calculate, aggregate, or redefine existing measures, creating new measure indicators.
Custom aggregation: Calculated Members can be used to define custom aggregation operations. Users can use calculated members to create new aggregation rules, such as calculating averages, sums, percentages, etc. This allows users to flexibly aggregate and summarize data based on specific business requirements and analysis needs.
Dynamic and interactive: Calculated Members can dynamically calculate and display data based on user queries and context. This means that as users analyze and explore data, calculated members can update results in real-time based on current selections and filter conditions, providing interactivity with the data.
Advanced calculations: Calculated Members can also be used to meet more complex analysis and calculation requirements. Users can leverage calculated members to perform advanced data modeling, such as creating time-related calculations, comparative analysis, predictive models, etc. This expands the capabilities of the semantic model, enabling users to perform deeper data mining and insights.
For example, if we need to calculate Profit, we can add a calculated member in the Calculated Members area and edit its calculation formula as shown in the below:
[Measures].[Sales Amount] - [Measures].[Total Product Cost]
Similarly, let's add another calculated member, Profit Margin, with the following calculation formula:
[Measures].[Profit] / [Measures].[Sales Amount]
The Profit Margin calculation formula here involves a percentage calculation. To ensure it is displayed in percentage format in the visualization components, set the Unit property to %.
By using calculated members, the semantic model provides flexibility and scalability, allowing users to create customized calculations and measure indicators based on specific business needs and analysis goals. This helps users gain a comprehensive understanding of the data, discover underlying correlations and patterns, and support more accurate decision-making and business optimization.
For more documentation on calculated members, please refer to the 🧮 Calculated Members page.
Data Preview
The data preview feature allows users to drag and drop dimensions, measures, and calculated members onto rows, columns, or filters to preview the query results of the multidimensional dataset. This interactive approach enables users to quickly explore and understand the data, gaining insights into its structure, distribution, and relationships.
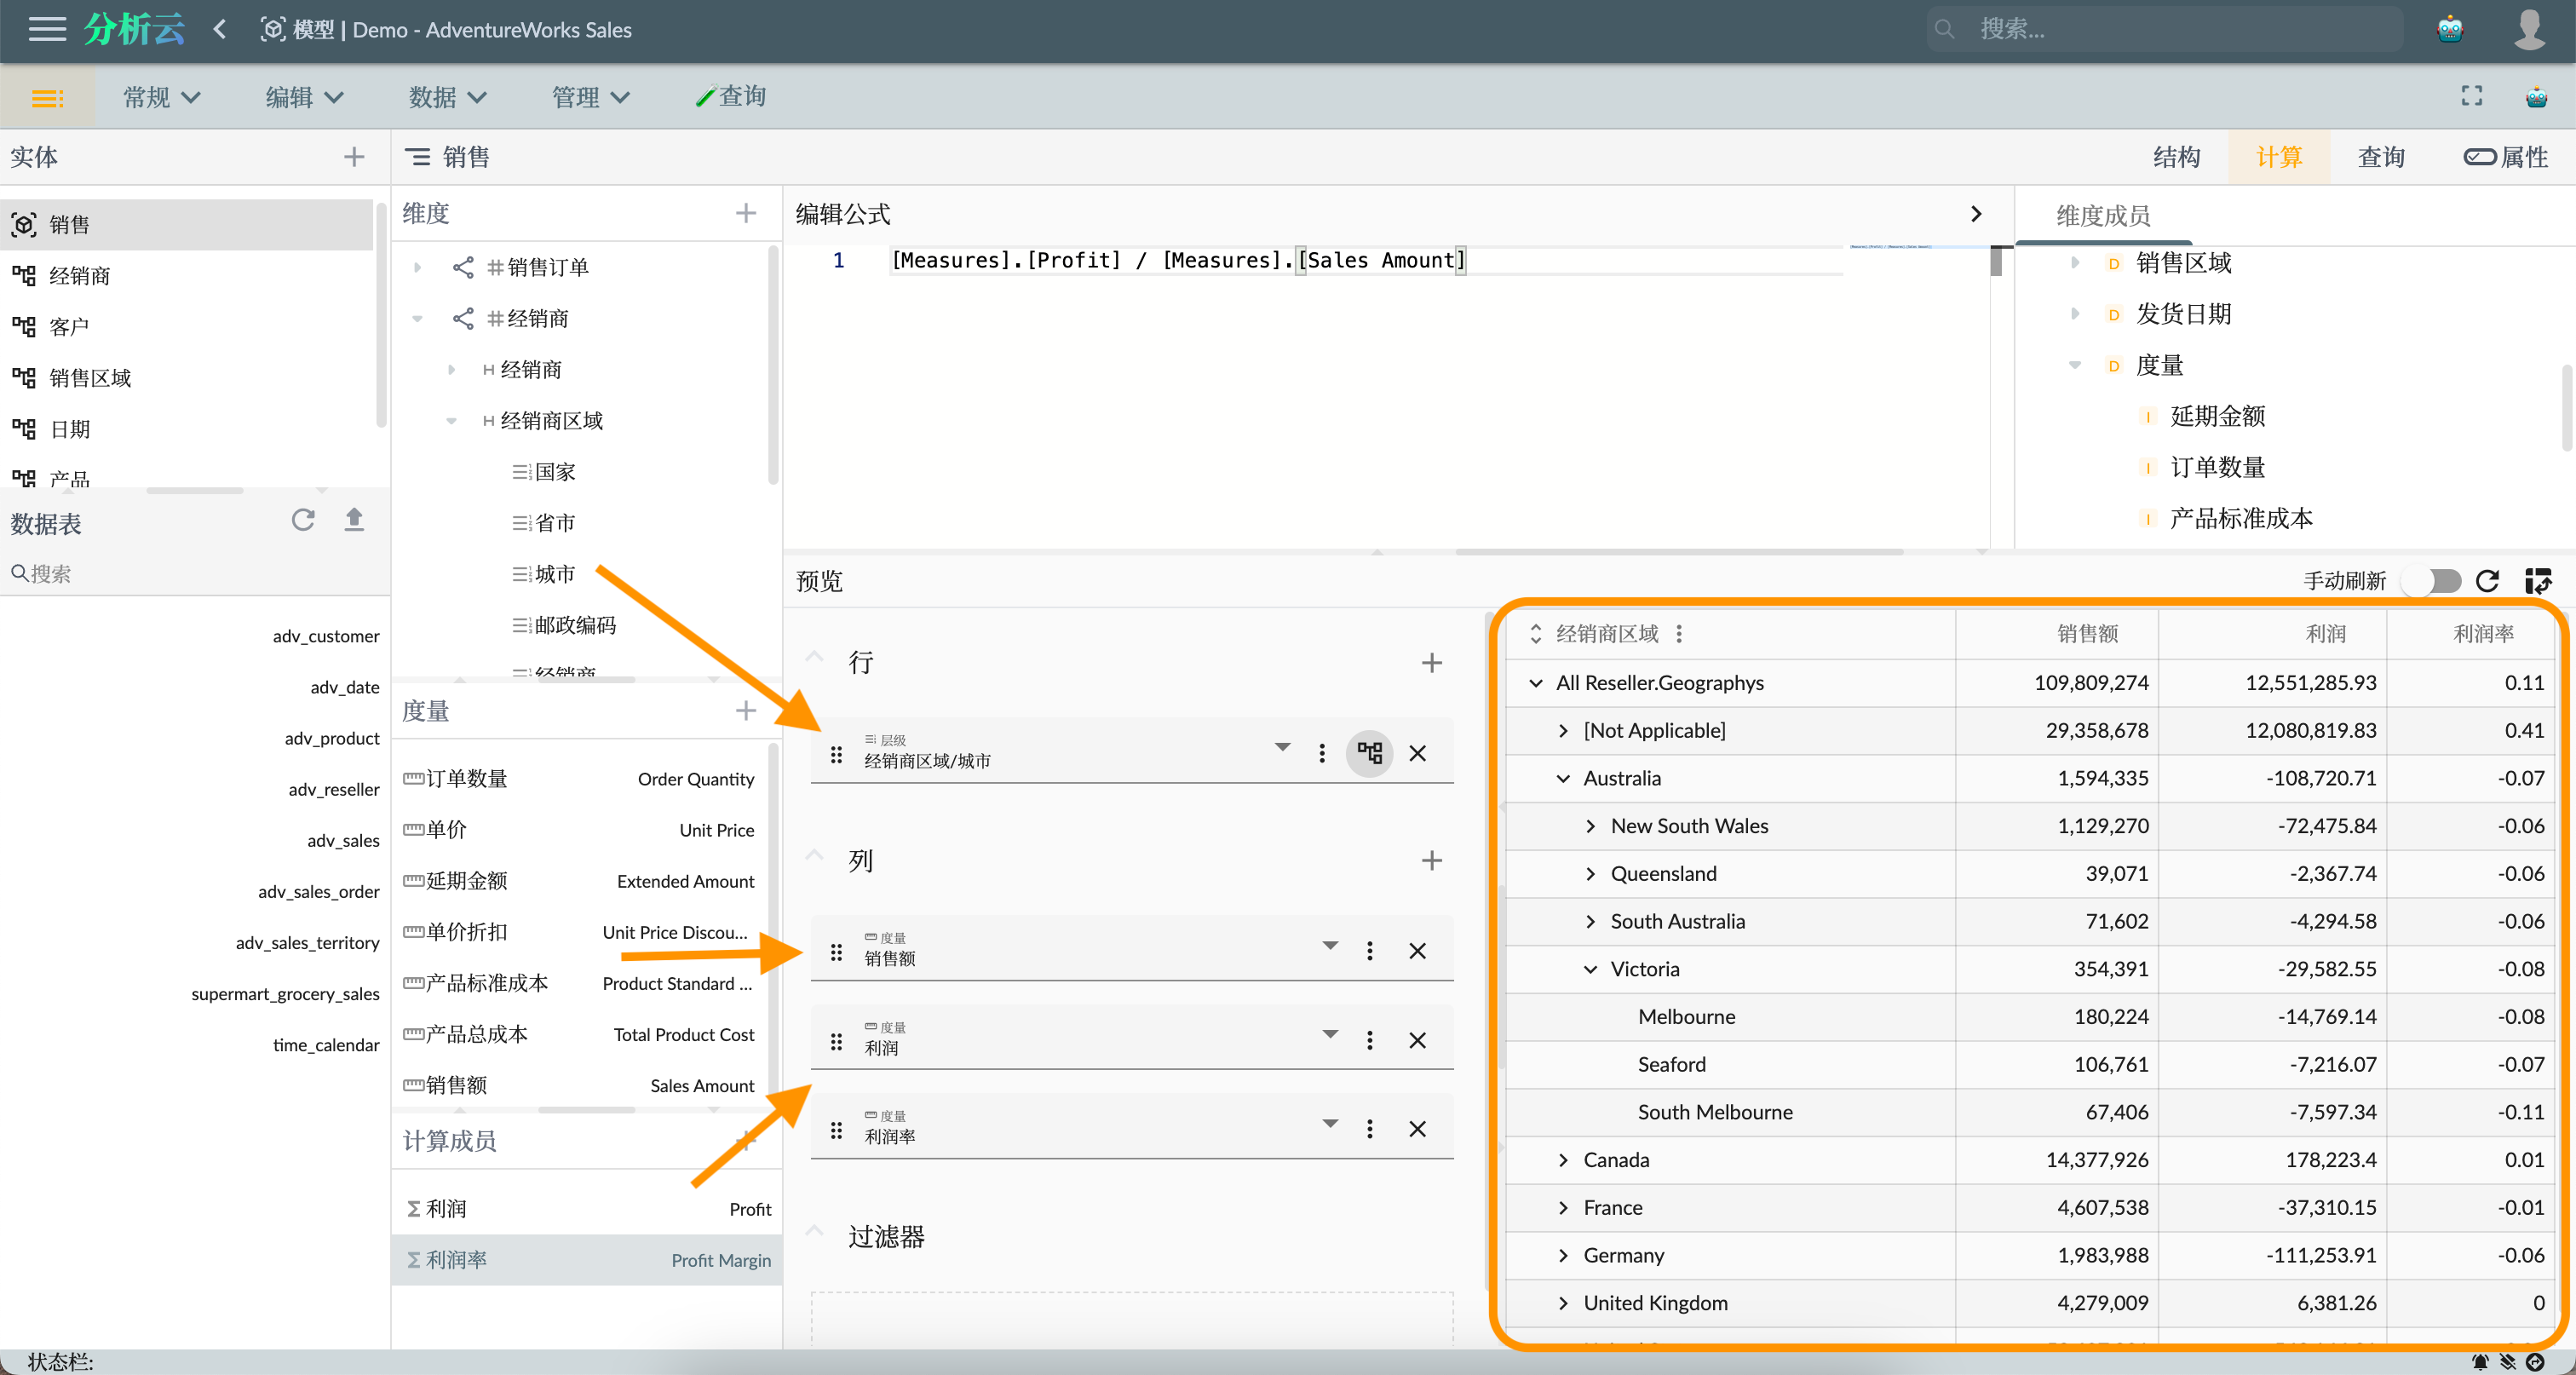
For more information about the preview functionality of cube entity, please refer to 🧊Cube Designer - Calculations.
Query Statement
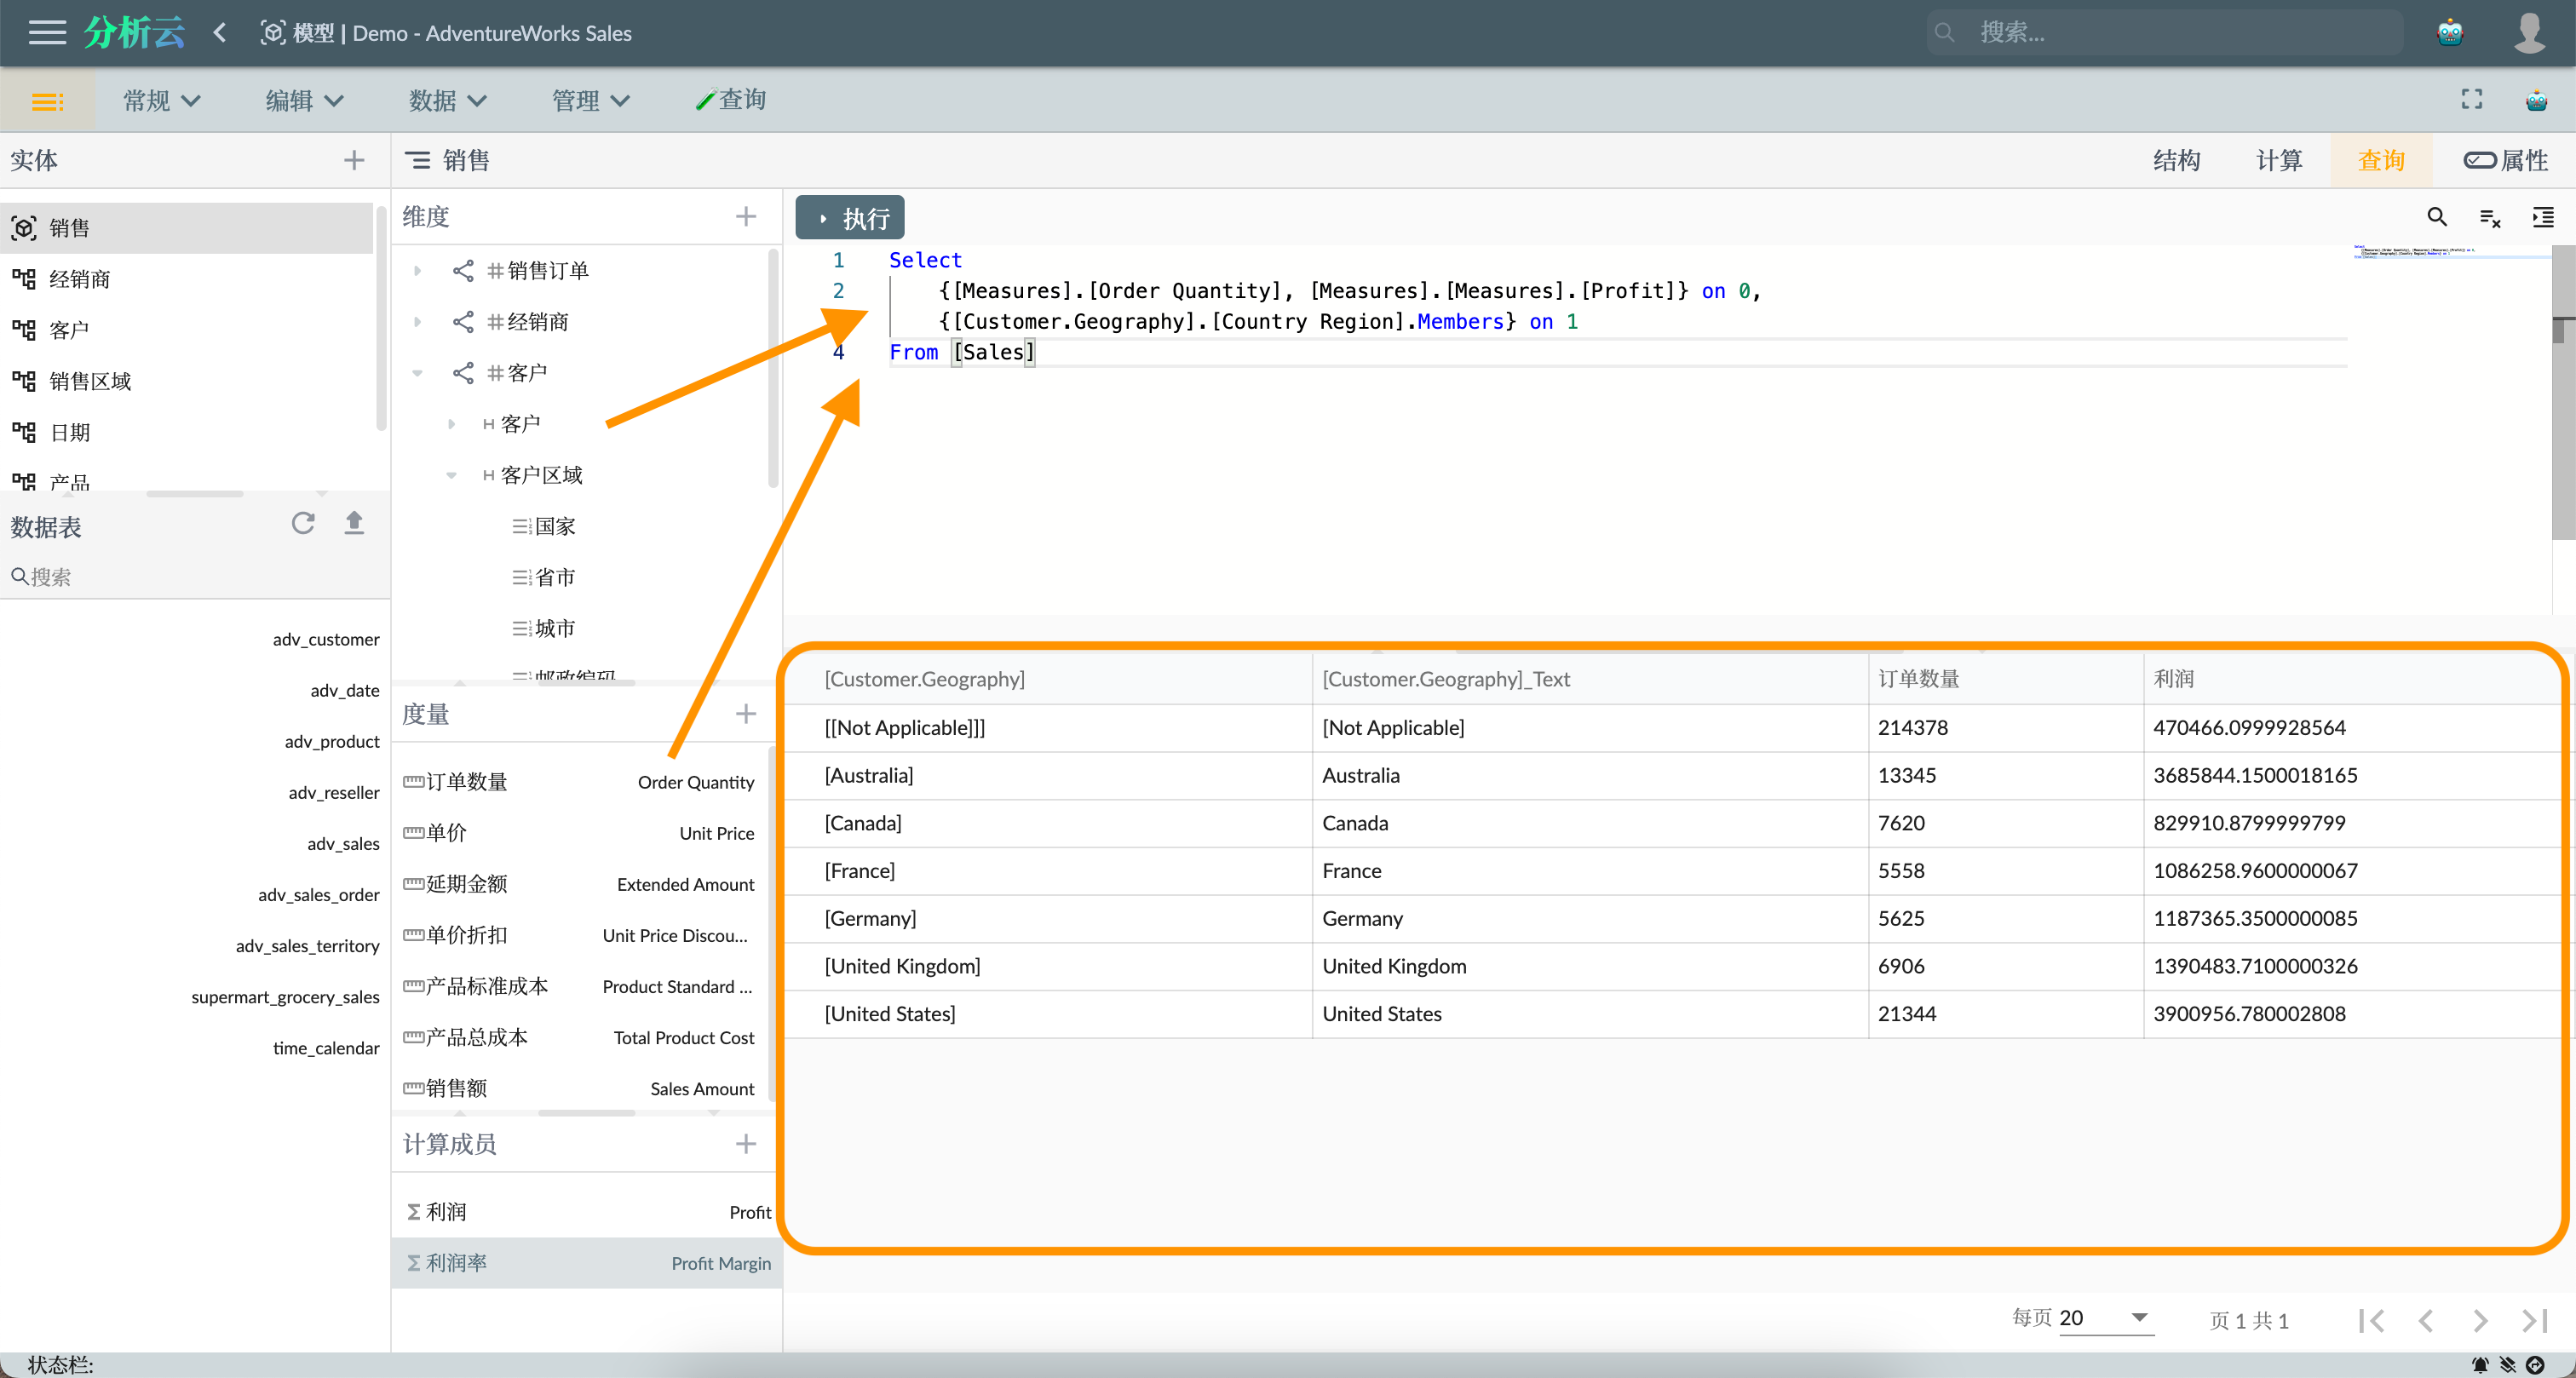
The custom query statement feature of cube entity allows users to perform data analysis and exploration in a customized way by writing MDX (Multidimensional Expression) query statements. MDX is a query language commonly used for accessing and manipulating OLAP (Online Analytical Processing) data sources in multidimensional data analysis.
Summary
In today's data-driven era, harnessing the power of data for in-depth analysis and insights has become crucial for businesses to gain a competitive advantage. This article describes how to leverage the semantic modeling capabilities of Metabase to achieve similar modeling functionality as Power BI, using the AdventureWorks Sales dataset as an example. The AdventureWorks Sales dataset includes multiple tables such as customers, dates, products, resellers, sales orders, and sales territories. By creating dimensions and multidimensional datasets, we can build a comprehensive data relationship model. The process of creating a semantic model involves defining dimensions, creating hierarchies, setting up shared dimensions, and adding calculated members. These features help users better understand and analyze the data, enabling more accurate decision-making and business optimization.