How to Analyze SAP BW Data Model
SAP BW (SAP Business Warehouse) is an enterprise data warehouse system developed by SAP, designed to support data analysis and decision-making in businesses. It is an integrated, enterprise-level solution that consolidates data from different systems into a single data repository. The data model of SAP BW adopts a star schema, where data is stored in a central repository and can be efficiently queried and analyzed. Data can be collected from multiple sources, including SAP applications and other external systems. SAP BW also supports multidimensional analysis and data mining capabilities, enabling efficient data analysis using OLAP (Online Analytical Processing) technology.
Meta Analysis Cloud enhances the semantic model of SAP BW by connecting to the SAP BW system using the XMLA (XML for Analysis) protocol, enabling more powerful data analysis capabilities. Meta Analysis Cloud can directly access data cubes or queries in the SAP BW system and enhance the semantic model of the SAP BW system. During the process of enhancing the semantic model, users can create new measures and calculated members, modify dimension and measure descriptions, and extend the functionality of data analysis.
In this tutorial, we will introduce how to connect to the SAP BW system using Meta Analysis Cloud and create a semantic model for data analysis.
Data Source
Refer to the document SAP BW Data Sources to create a data source.
Semantic Model
The semantic model is a core feature in Meta Analysis Cloud that provides various functionalities to enhance data analysis capabilities, including:
- Query Lab
The Query Lab helps users quickly create and test MDX query statements. In the Query Lab, users can use AI Copilot to generate query statements for data retrieval using natural language. Session records can be saved and query results can be exported.
- Model Semantic Enhancement
The semantic model provides a simple way to enhance the semantics of the data model. It allows for the calculation of new measures and dimension members for BW Cubes or Queries, modification of label descriptions, setting measure number formats, and assigning semantic types to dimensions, among other enhancement capabilities.
- Caching
The semantic model allows for the configuration of caching for querying BW data, including enabling caching and setting cache expiration time, to improve query efficiency.
For more details, refer to the document Semantic Enhancement for Third-Party OLAP Cube.
Creating a Semantic Model
Click on "New" in the semantic model management page to open the creation wizard. Enter a name, select the SAP BW data source that has been created, and wait for the system to retrieve all service catalogs. After selecting a desired service catalog, click on "Apply".
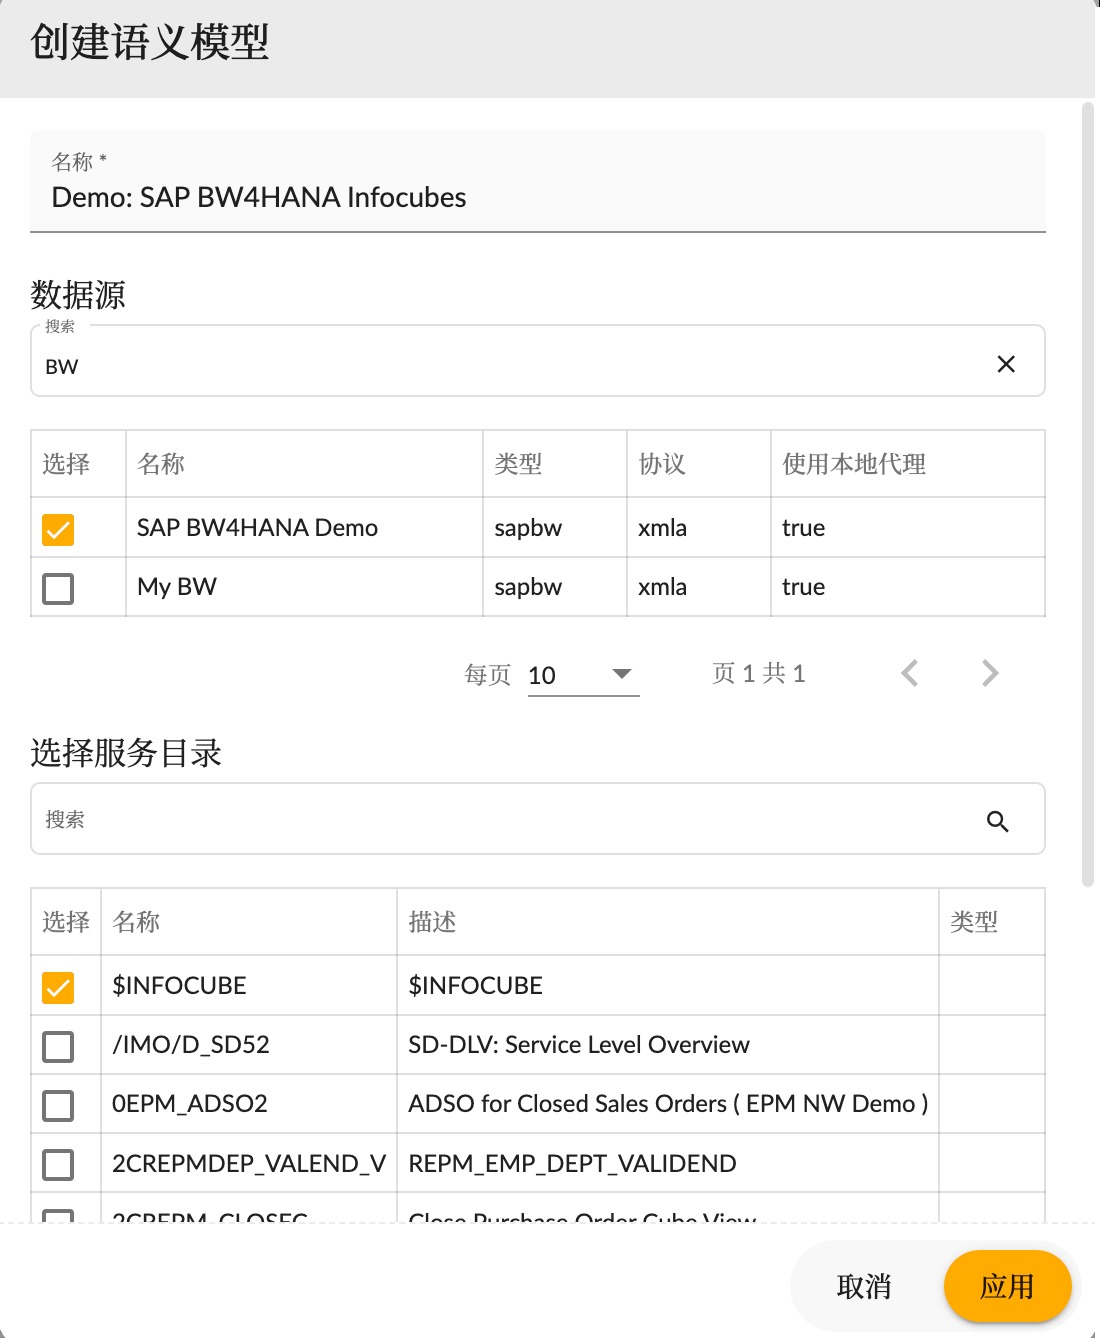
After successful creation, users can use this model space to enhance and analyze SAP BW model data.
Query Lab
MDX (Multidimensional Expressions) language is a query language for OLAP data sources, which helps users efficiently extract desired information from multidimensional data. In the Query Lab, users can use MDX query language to analyze data in SAP BW Cubes or Queries.
By dragging the model to the Table Structure area, users can view the dimension and measure structure information of the model and drag the structure information to the editor to assist in writing MDX query statements.
For more general functionalities, refer to the document 🧪Query Lab.
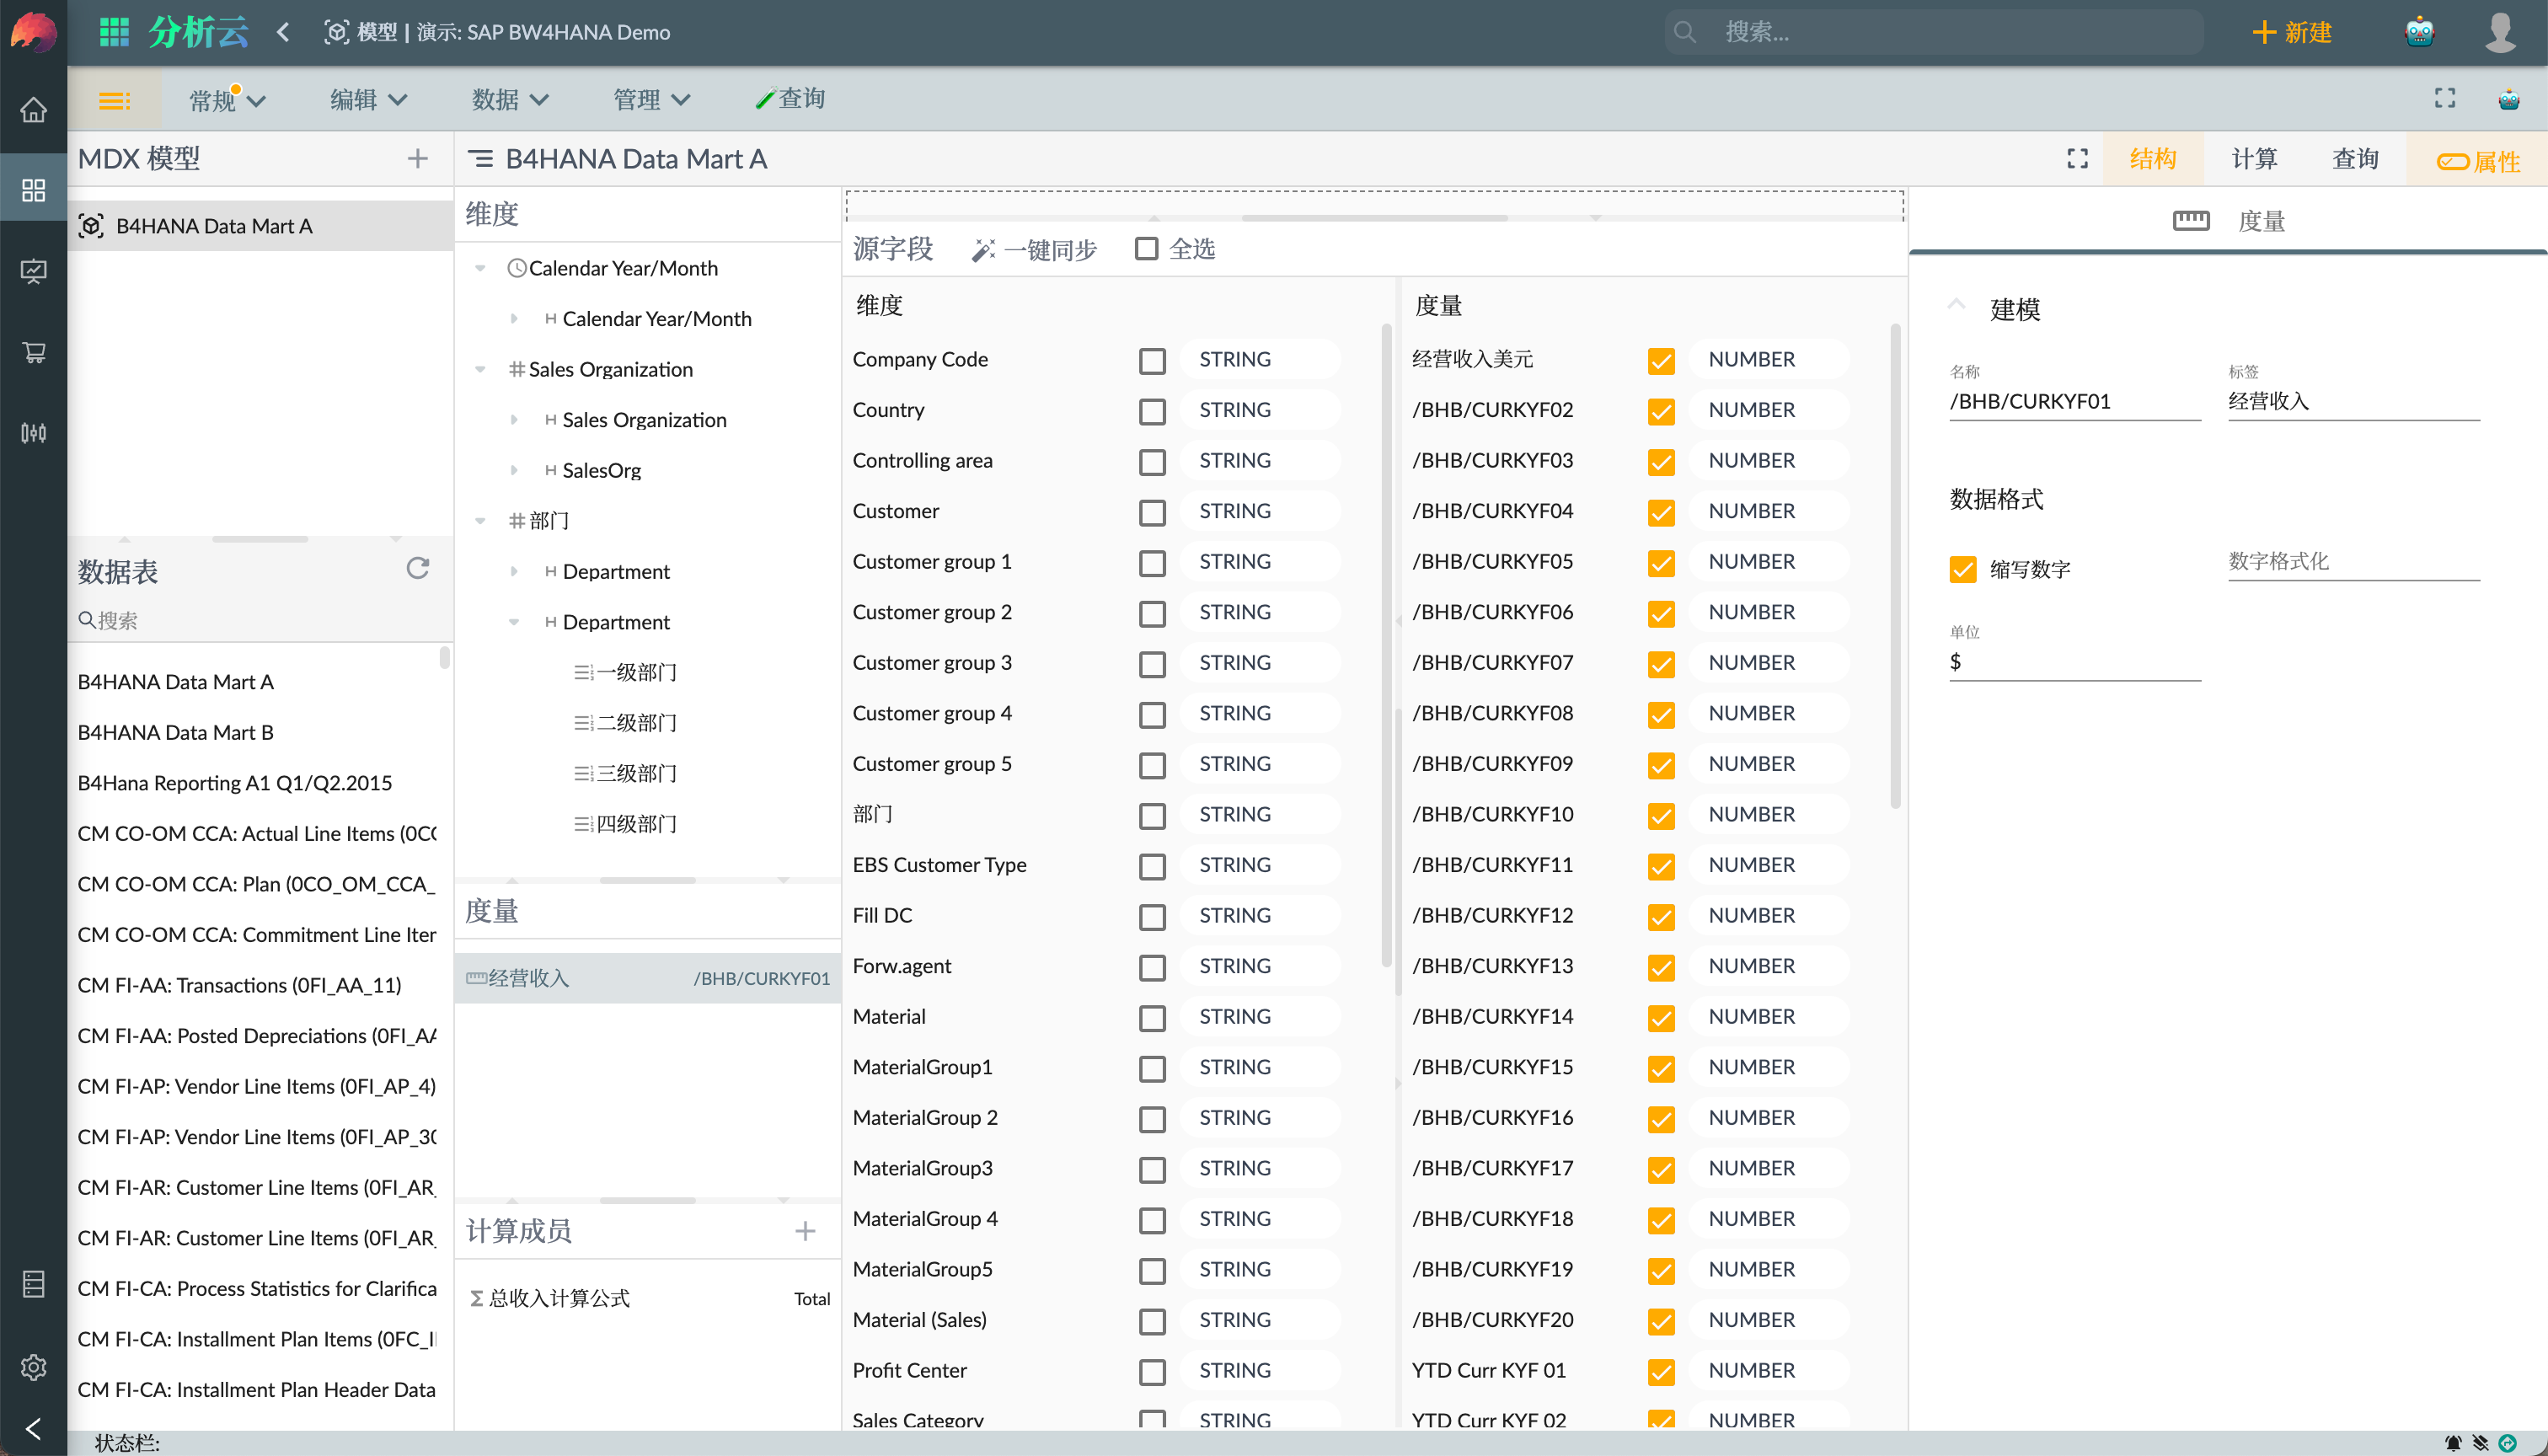
Cube Semantic Enhancement
For SAP BW Cubes or Queries, model enhancement can include the calculation of new measures and dimension members, modification of label descriptions, setting measure number formats, and assigning semantic types to dimensions, among other enhancement capabilities.
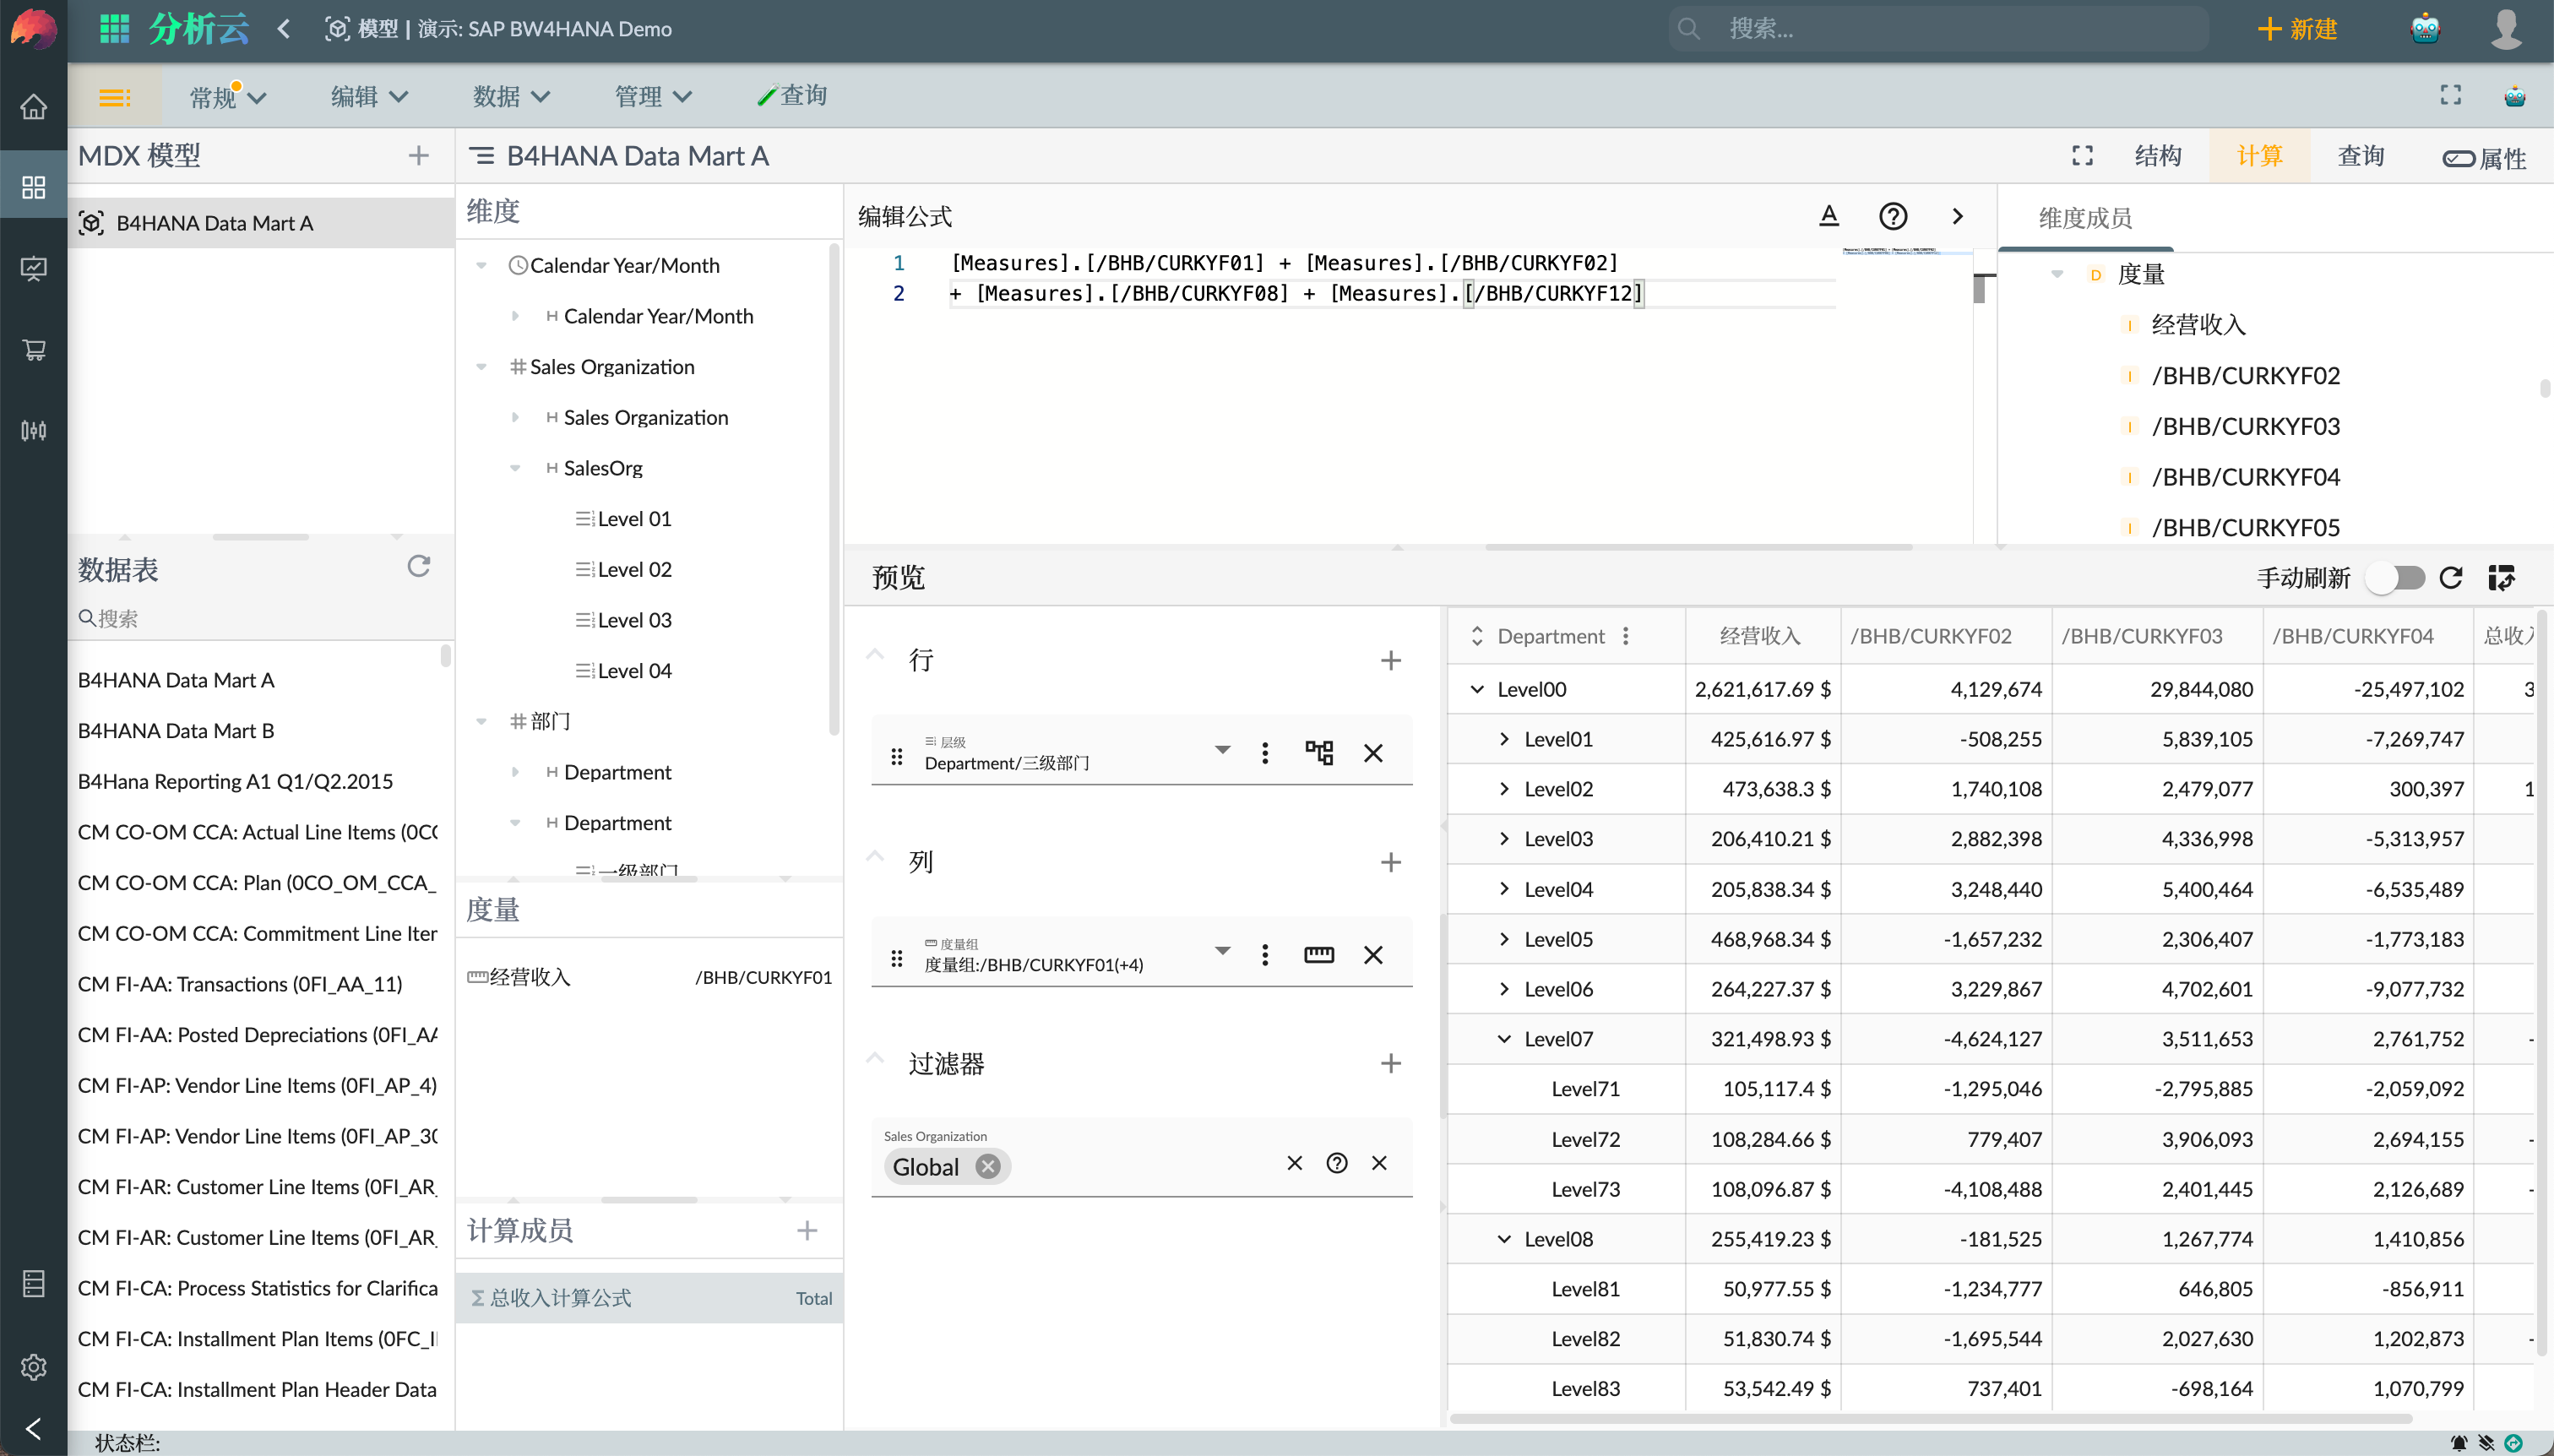
Adding Calculated Members
Calculated Members are new members calculated from existing dimensions and measures. They are not actual data stored in the Cube, but dynamically calculated during queries. Calculated Members can be used to process, integrate, and supplement raw data for better data understanding and decision-making.
The reasons why we need calculated members are as follows:
- Data Complexity: Data in the model is usually complex and requires certain calculations and processing to better understand the data and make decisions.
- Real-time Data: In some cases, data needs to be calculated and analyzed based on real-time business needs, rather than relying solely on predefined indicators and measures.
- Business Flexibility: Models often need to be adjusted and customized based on different business needs and scenarios to better support business decisions and data analysis.
Story Dashboard
The Story Dashboard in Meta Analysis Cloud is an interactive data visualization tool that helps users present data in the form of charts, graphs, tables, and more, and supports data exploration and interactive analysis. The Story Dashboard provides a variety of data visualization components, including bar charts, line charts, pie charts, maps, etc. Users can simply drag and drop different data visualization components into the dashboard and configure and customize them.
The Story Dashboard provides rich associative analysis features, including Input Controls, Filter Bars, and Slicers.
Input Controls allow users to change the results of data analysis by selecting options or entering values. For example, users can use input controls to select a time range or product type for better data analysis. Input controls can take the form of dropdown menus, radio buttons, checkboxes, etc.
Filter Bars and Slicers are tools used to filter and select data. They allow users to choose data based on different dimensions to better analyze the data. Filter Bars are usually displayed at the top or left side of the dashboard and can filter multiple dimensions simultaneously, while Input Controls are usually displayed next to specific data visualization components and can filter based on a single dimension. When using Filter Bars or Slicers, users can select one or more values or use the search function to find specific values.
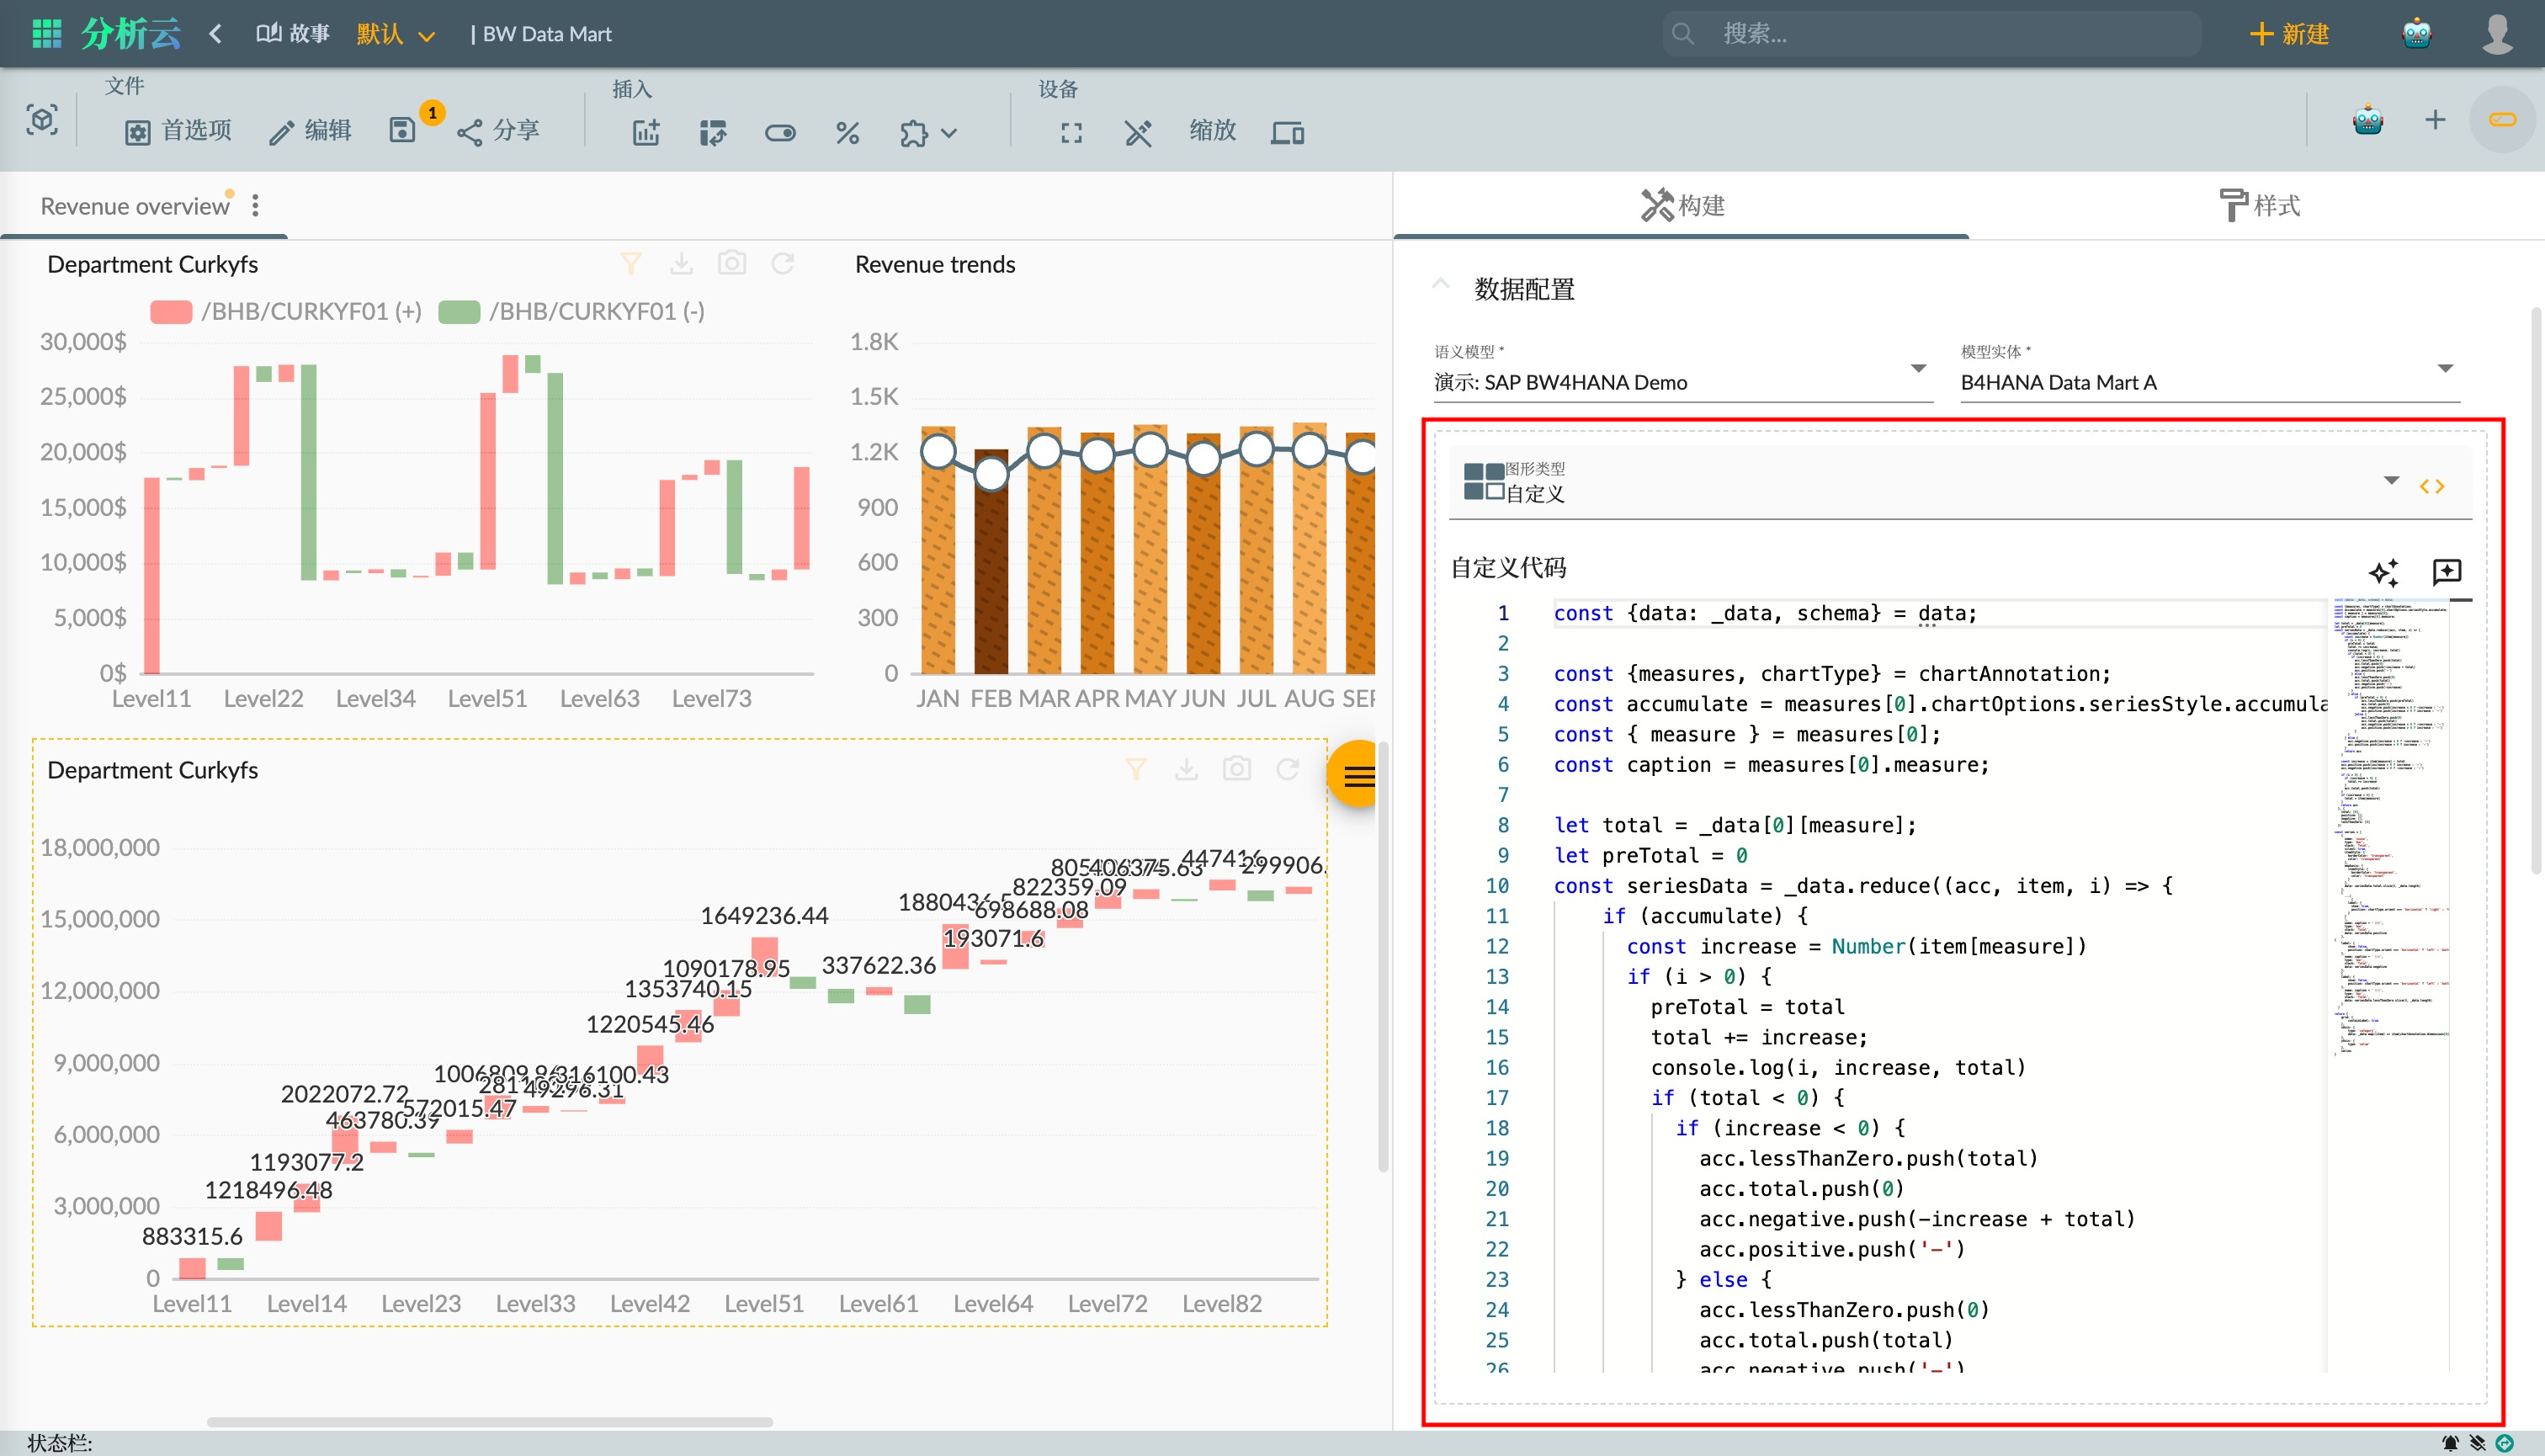
Custom Chart Logic
The Story Dashboard in Meta Analysis Cloud provides the ability to customize chart logic using JavaScript code, allowing users to implement additional functionality for their chart display requirements.
Users can create their own chart logic script by selecting the Custom chart type.
For more details on custom chart types, refer to the document Custom Chart.
Calculations
In the Story Dashboard, you can also create calculated members. Unlike the calculated members in the semantic model, calculated members in the Story Dashboard are only valid within the current story. Various types of calculated members can be created in the Story Dashboard:
- Calculated Formula: Calculate the value of a measure using MDX formulas, such as calculating percentages, growth rates, etc.
- Conditional Aggregation: Aggregate data based on conditions, such as aggregating sales by region, time, product, etc.
- Restricted Measure: Limit the calculation scope of a measure based on filtering conditions, such as calculating sales only within a certain time period or for a certain product.
- Difference From: Calculate the difference between the current period measure value and another period measure value, such as calculating the difference or ratio between sales this month and sales last month.
In addition to creating different types of calculated members separately, users can create another calculated member using an already created calculated measure, allowing for nested calculations to achieve complex logic calculations.
Furthermore, when creating calculated members, users can use parameters to control the input of calculation formulas and dynamically change the parameter values using input controls in the Story Dashboard for dynamic calculations.
For more details, refer to the document Calculated Measures.
Summary
In summary, using Meta Analysis Cloud to directly connect to SAP BW models for data analysis has the following advantages:
- Fast Connection: By connecting to SAP BW using the XMLA protocol, the process of data integration and transformation is avoided, and data is directly retrieved from the SAP BW system, greatly reducing the time for users to analyze and retrieve data.
- Flexible Querying: Using the MDX language for querying allows for flexible cross-dimensional analysis, complex calculations, and data aggregation, while also supporting advanced analysis features such as multidimensional analysis and associative analysis.
- Fine-grained Access Control: Meta Analysis Cloud supports access control for semantic models, allowing for different levels of data access restrictions for different users or user groups, ensuring data security and privacy.
- Diverse Presentations: Meta Analysis Cloud supports various data visualization methods, including bar charts, pie charts, line charts, tables, etc., and also allows for custom JavaScript code to extend and customize data visualization functionality and effects.