With the arrival of the third quarter of 2023, Xpert Analytics Cloud has once again stepped into a brand new version, bringing a series of exciting features and architectural upgrades. In this blog post, we will focus on the latest features of Xpert Analytics Cloud 2023 Q3 and the upgrade of the software architecture.
1. Software Architecture Upgrade
1.1 Angular 16 & Signal State Management
The Xpert analytics cloud has been successfully upgraded to the new Angular 16 version, bringing users a faster and smoother user experience. In terms of UI component state management, we have taken an important step and started to rewrite it step by step in a brand new way Signal. This will not only improve the stability and performance of the system, but also make the development process more efficient.
1.2 UI Design with Tailwind CSS
In terms of UI design, the Xpert analytics cloud 2023 Q3 version ushered in a revolutionary change. We have fully adopted Tailwind CSS to redesign the style of UI components, presenting users with a more modern and beautiful interface, and also improving the ease of operation.

1.2.1 Material Design Components Upgrade
Following the upgrade of Angular 16, we also upgraded the Material Design component to the latest version 16. This means that users will enjoy more novel and up-to-date UI elements, which will bring users a higher quality experience.
1.2.2 Use native HTML elements and Tailwind CSS form fields
In addition to upgrading Material Design components, Xpert analytics cloud also uses native HTML elements and Tailwind CSS combination design to replace the original Material Design form fields. This change not only makes the entire interface more concise and efficient, but also reduces additional dependencies, thereby improving system performance.
For example, the comparison before and after the upgrade of the dimension selector is shown in the following figure. The function buttons have not changed, but the user experience will be qualitatively improved.


2. New features
2.1 Story support multiple models
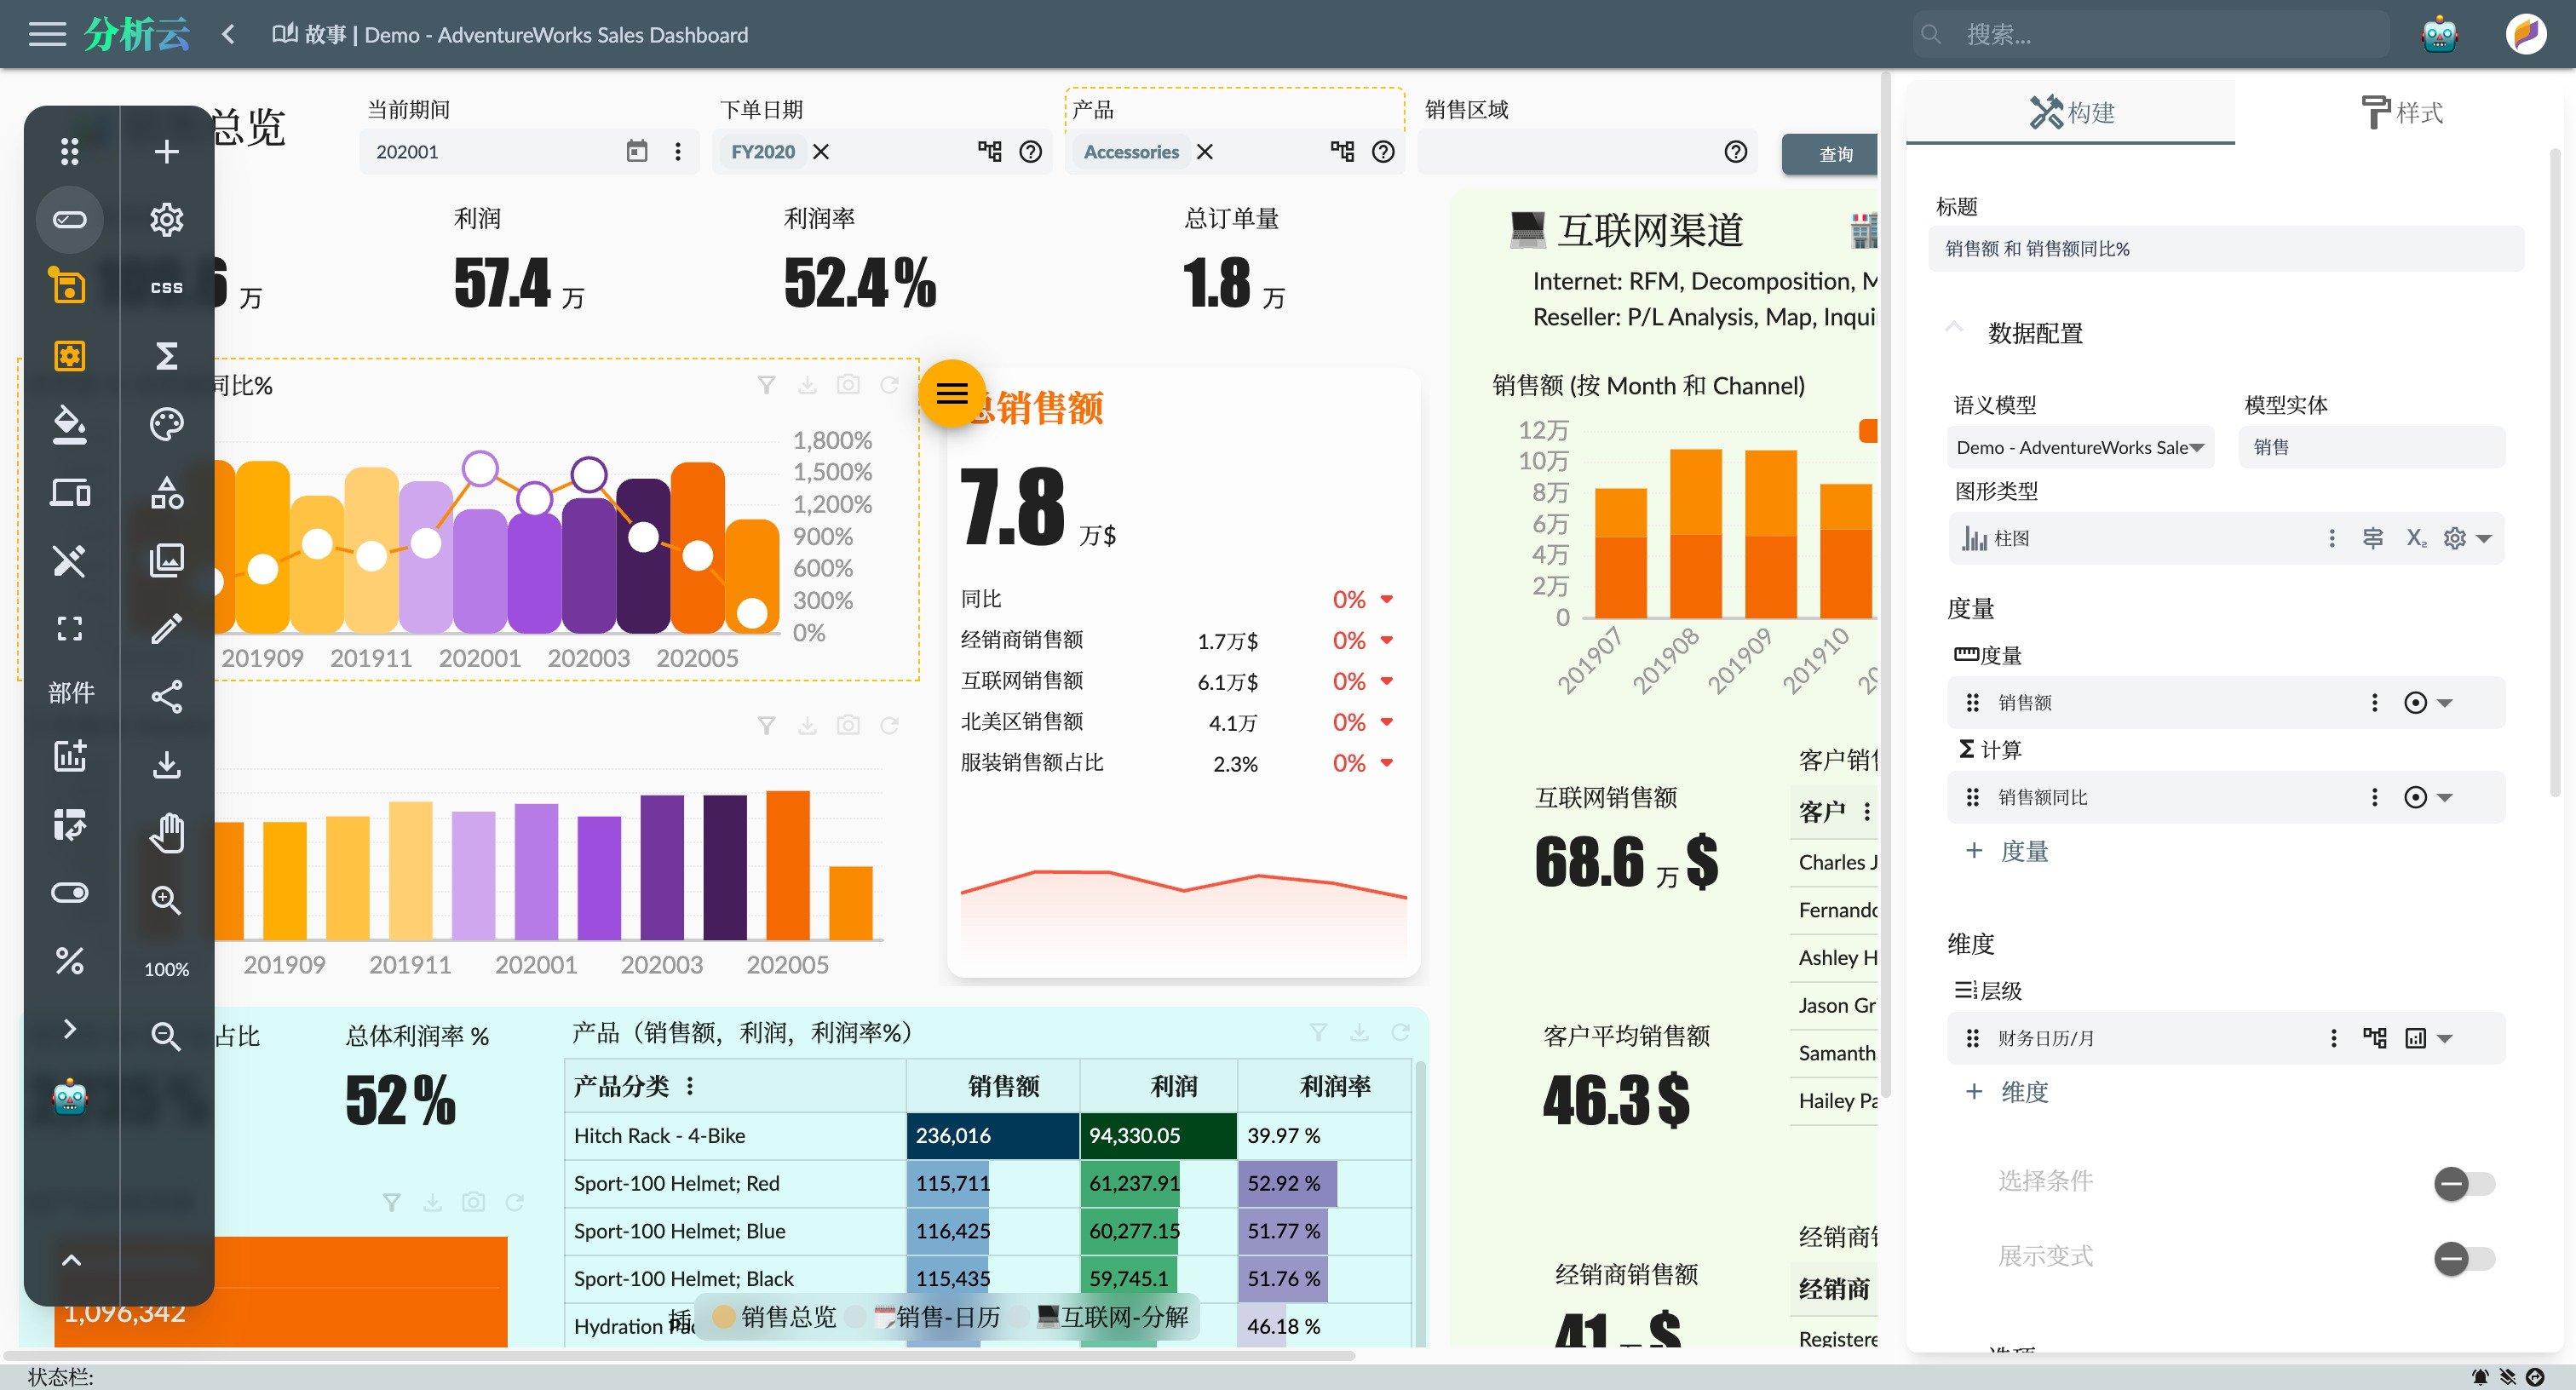
Xpert analytics cloud 2023 Q3 introduces a highly anticipated new feature: users can now support multiple semantic models in a single story dashboard. This means you can analyze and compare the results of different models more flexibly, providing more perspectives to support business decisions.
Here, multiple models refer to multiple semantic models, that is, the workspace of model entities. The original story dashboard can support different model entities in the same semantic model through the selection of model entities. Now by supporting multiple semantic models, the model entities from different data sources can be compared by comparing the data.
For example, companies have models from SAP BW, a commercial data warehouse software, and models from self-built data warehouses (Doris). Now you can display the models of these two data sources in the same story dashboard, so as to compare the data.
It should be noted that both data sources query data through direct connection, and there is no problem of performance and data redundancy caused by data copying.

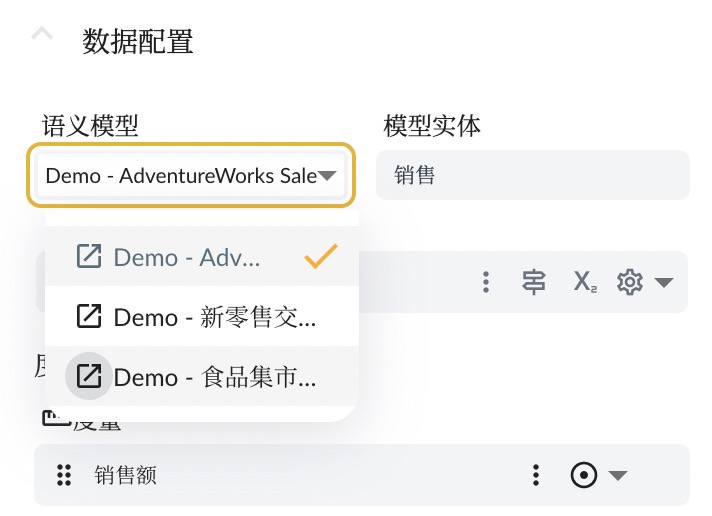
Users can switch the model workspace by selecting the semantic model attribute in the semantic model property editing panel of the story component, and then select the model entity, which can show the data of different models in the same story dashboard.
Users can also click the open button in front of each model in the model selection list to go to the corresponding semantic model workspace for viewing or editing.
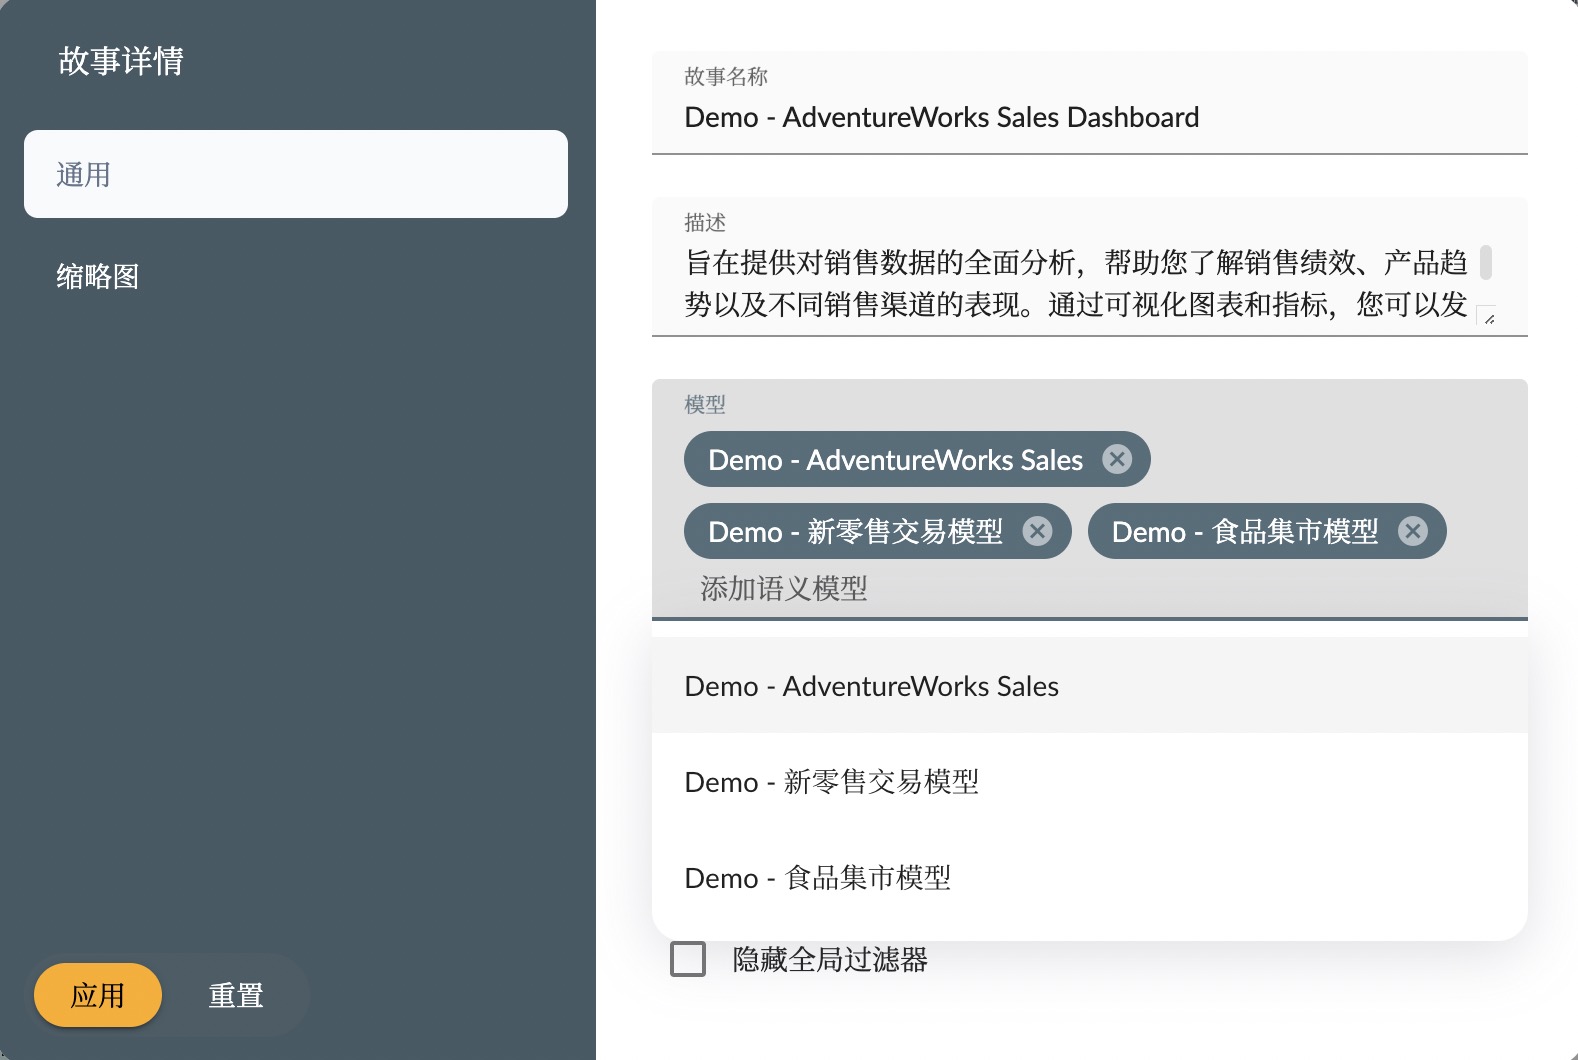
To use multiple models, you need to add multiple model components to the story dashboard. You can add them through the model attribute in the story details, and the optional model is the semantic model associated with the project where the story is located.

2.2 Pan and scale function
We heard from you, and we added some enhancements to the story pane. In this release, we added panning and zooming to the story pane to let you explore your data better, focus on the important information, and quickly switch to a global view to better understand the story behind your data.

Click the pan button, in translation mode, the canvas can be translated by dragging the mouse. The user can press the Alt key and drag the canvas with the mouse.
In zoom mode, you can zoom in and out the canvas by clicking the zoom button, or you can directly zoom in the menu. You can also use shortcuts:
- Alt + + zoom in 10%
- Alt + - zoom out 10%
- Alt + Esc reset inital state
2.3 Custom dimension caption
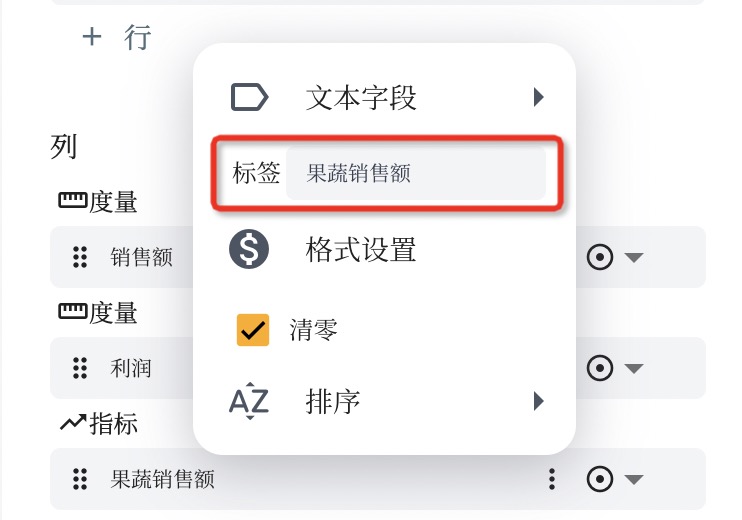
Xpert analytics cloud now supports custom dimension selector caption, which will allow users to more clearly identify the selected dimensions when creating reports and visualizations, thereby avoiding confusion and misunderstanding.

Summary
The release of Xpert Analytics Cloud 2023 Q3 version brings exciting new features and important architectural upgrades. From modernized UI design to enhanced Story functionality and support for multiple semantic models, this version will provide users with a more powerful, flexible and enjoyable data analytics experience. We encourage users to experience the infinite possibilities of these new features as soon as possible.