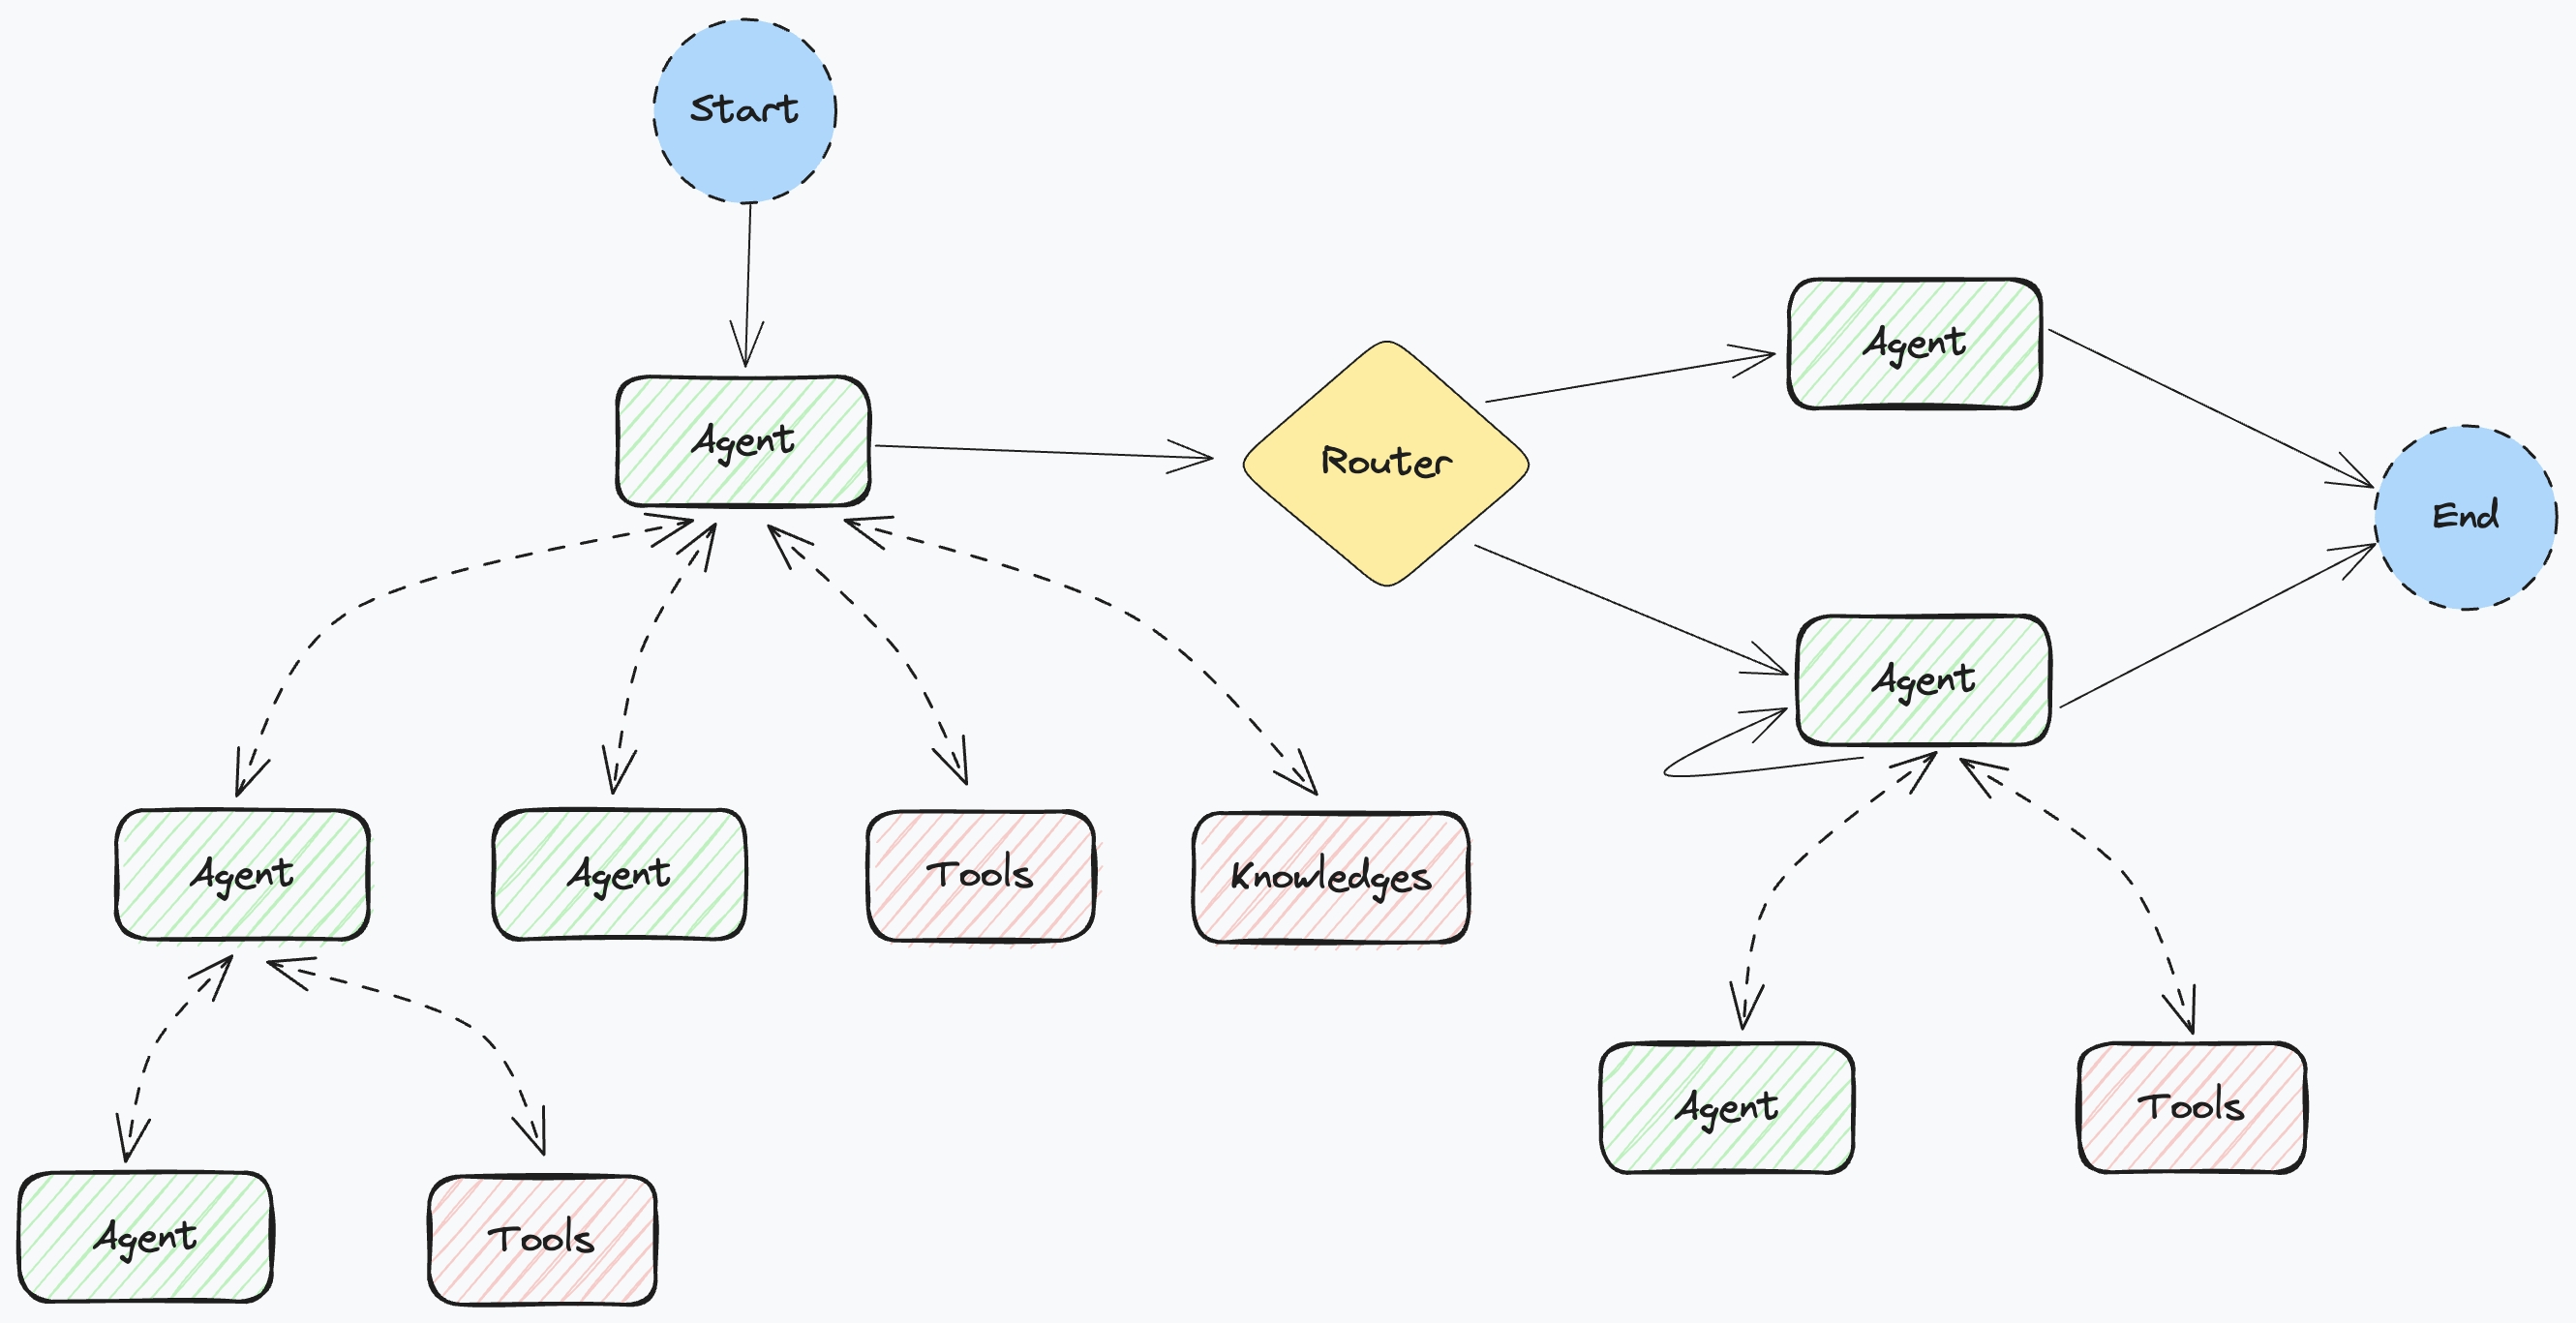
In today's rapidly evolving AI landscape, enterprises face a critical dilemma: how to balance the creativity of LLMs with the stability of processes? While purely agent-based architectures offer flexibility, they are difficult to control; traditional workflows, though reliable, lack adaptability. The Agent and Workflow Hybrid Architecture of the Xpert AI platform is designed to resolve this conflict — it allows AI to possess "free will" while adhering to "rules and order."
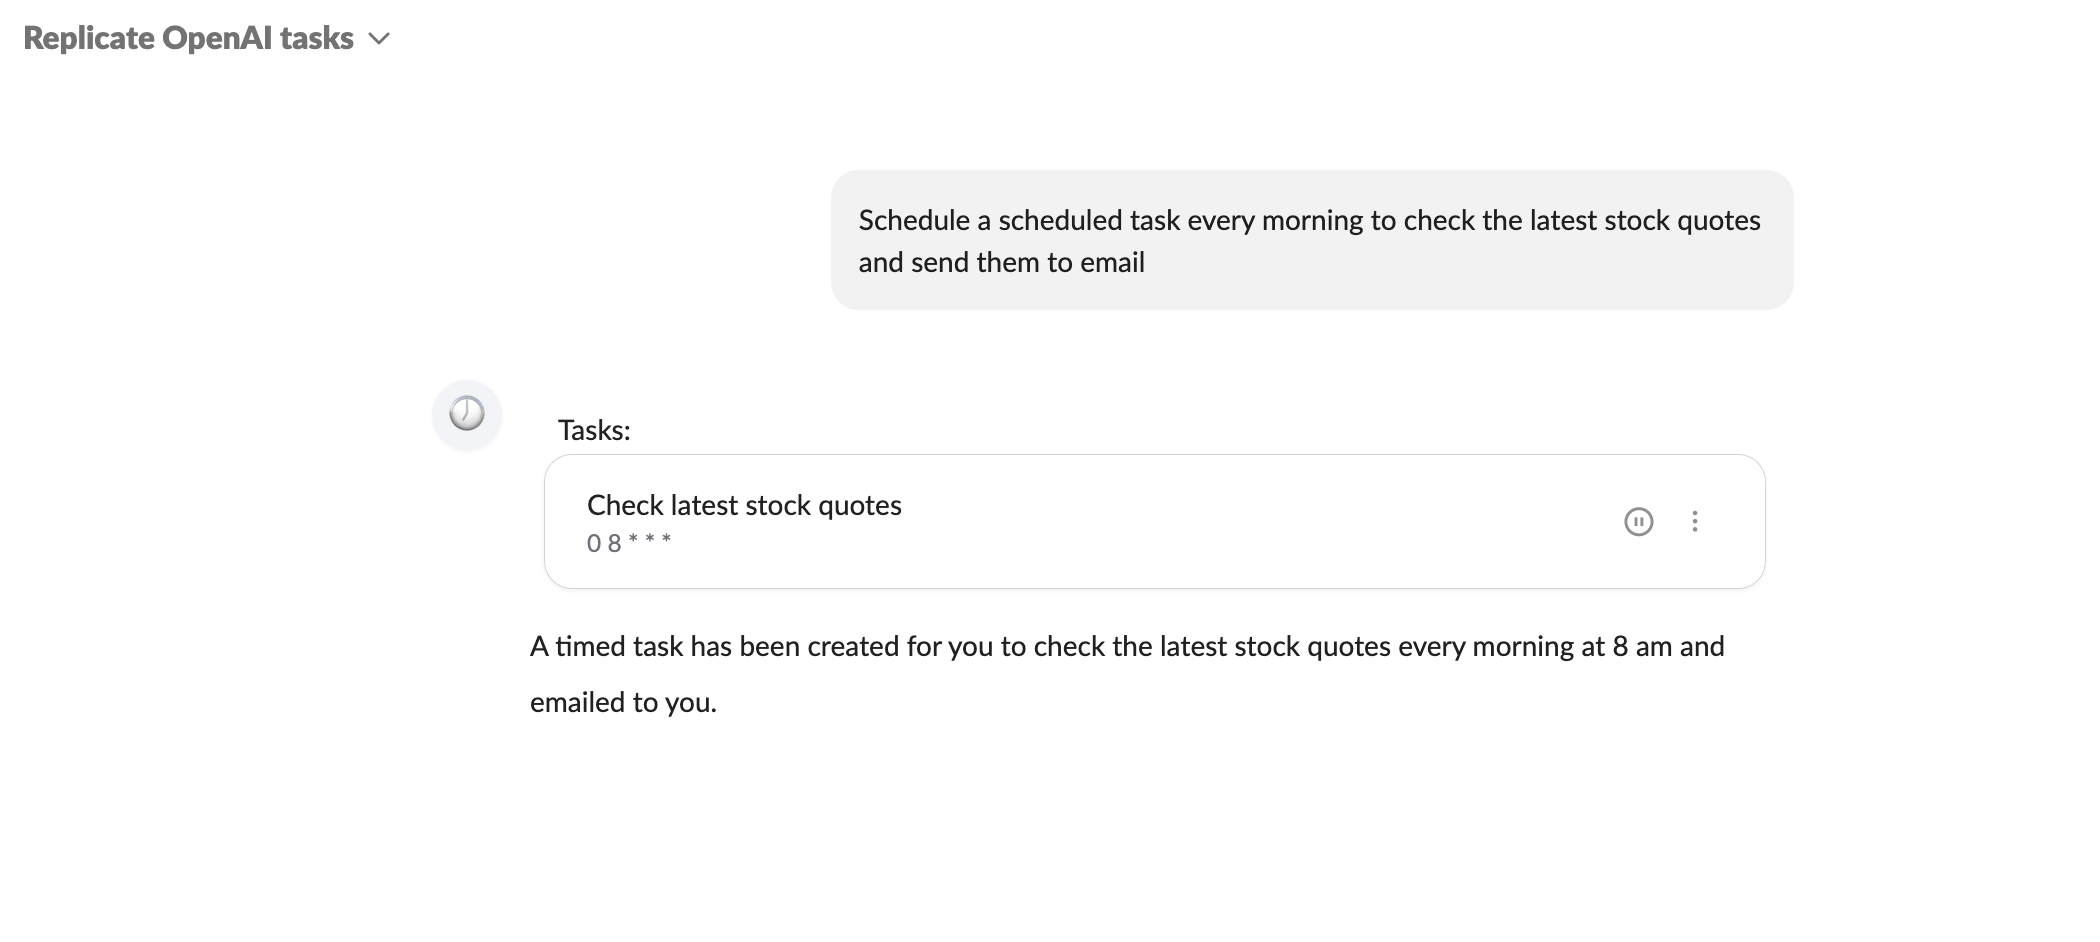
In today’s fast-paced world, effective task management is essential. XpertAI’s Scheduled Task Toolset integrates intelligent agents into your workflow, taking task scheduling and execution to the next level. This feature allows users to create, customize, and automate tasks, simplifying daily operations and boosting productivity. Let’s explore how this innovative toolset can transform your task management experience.
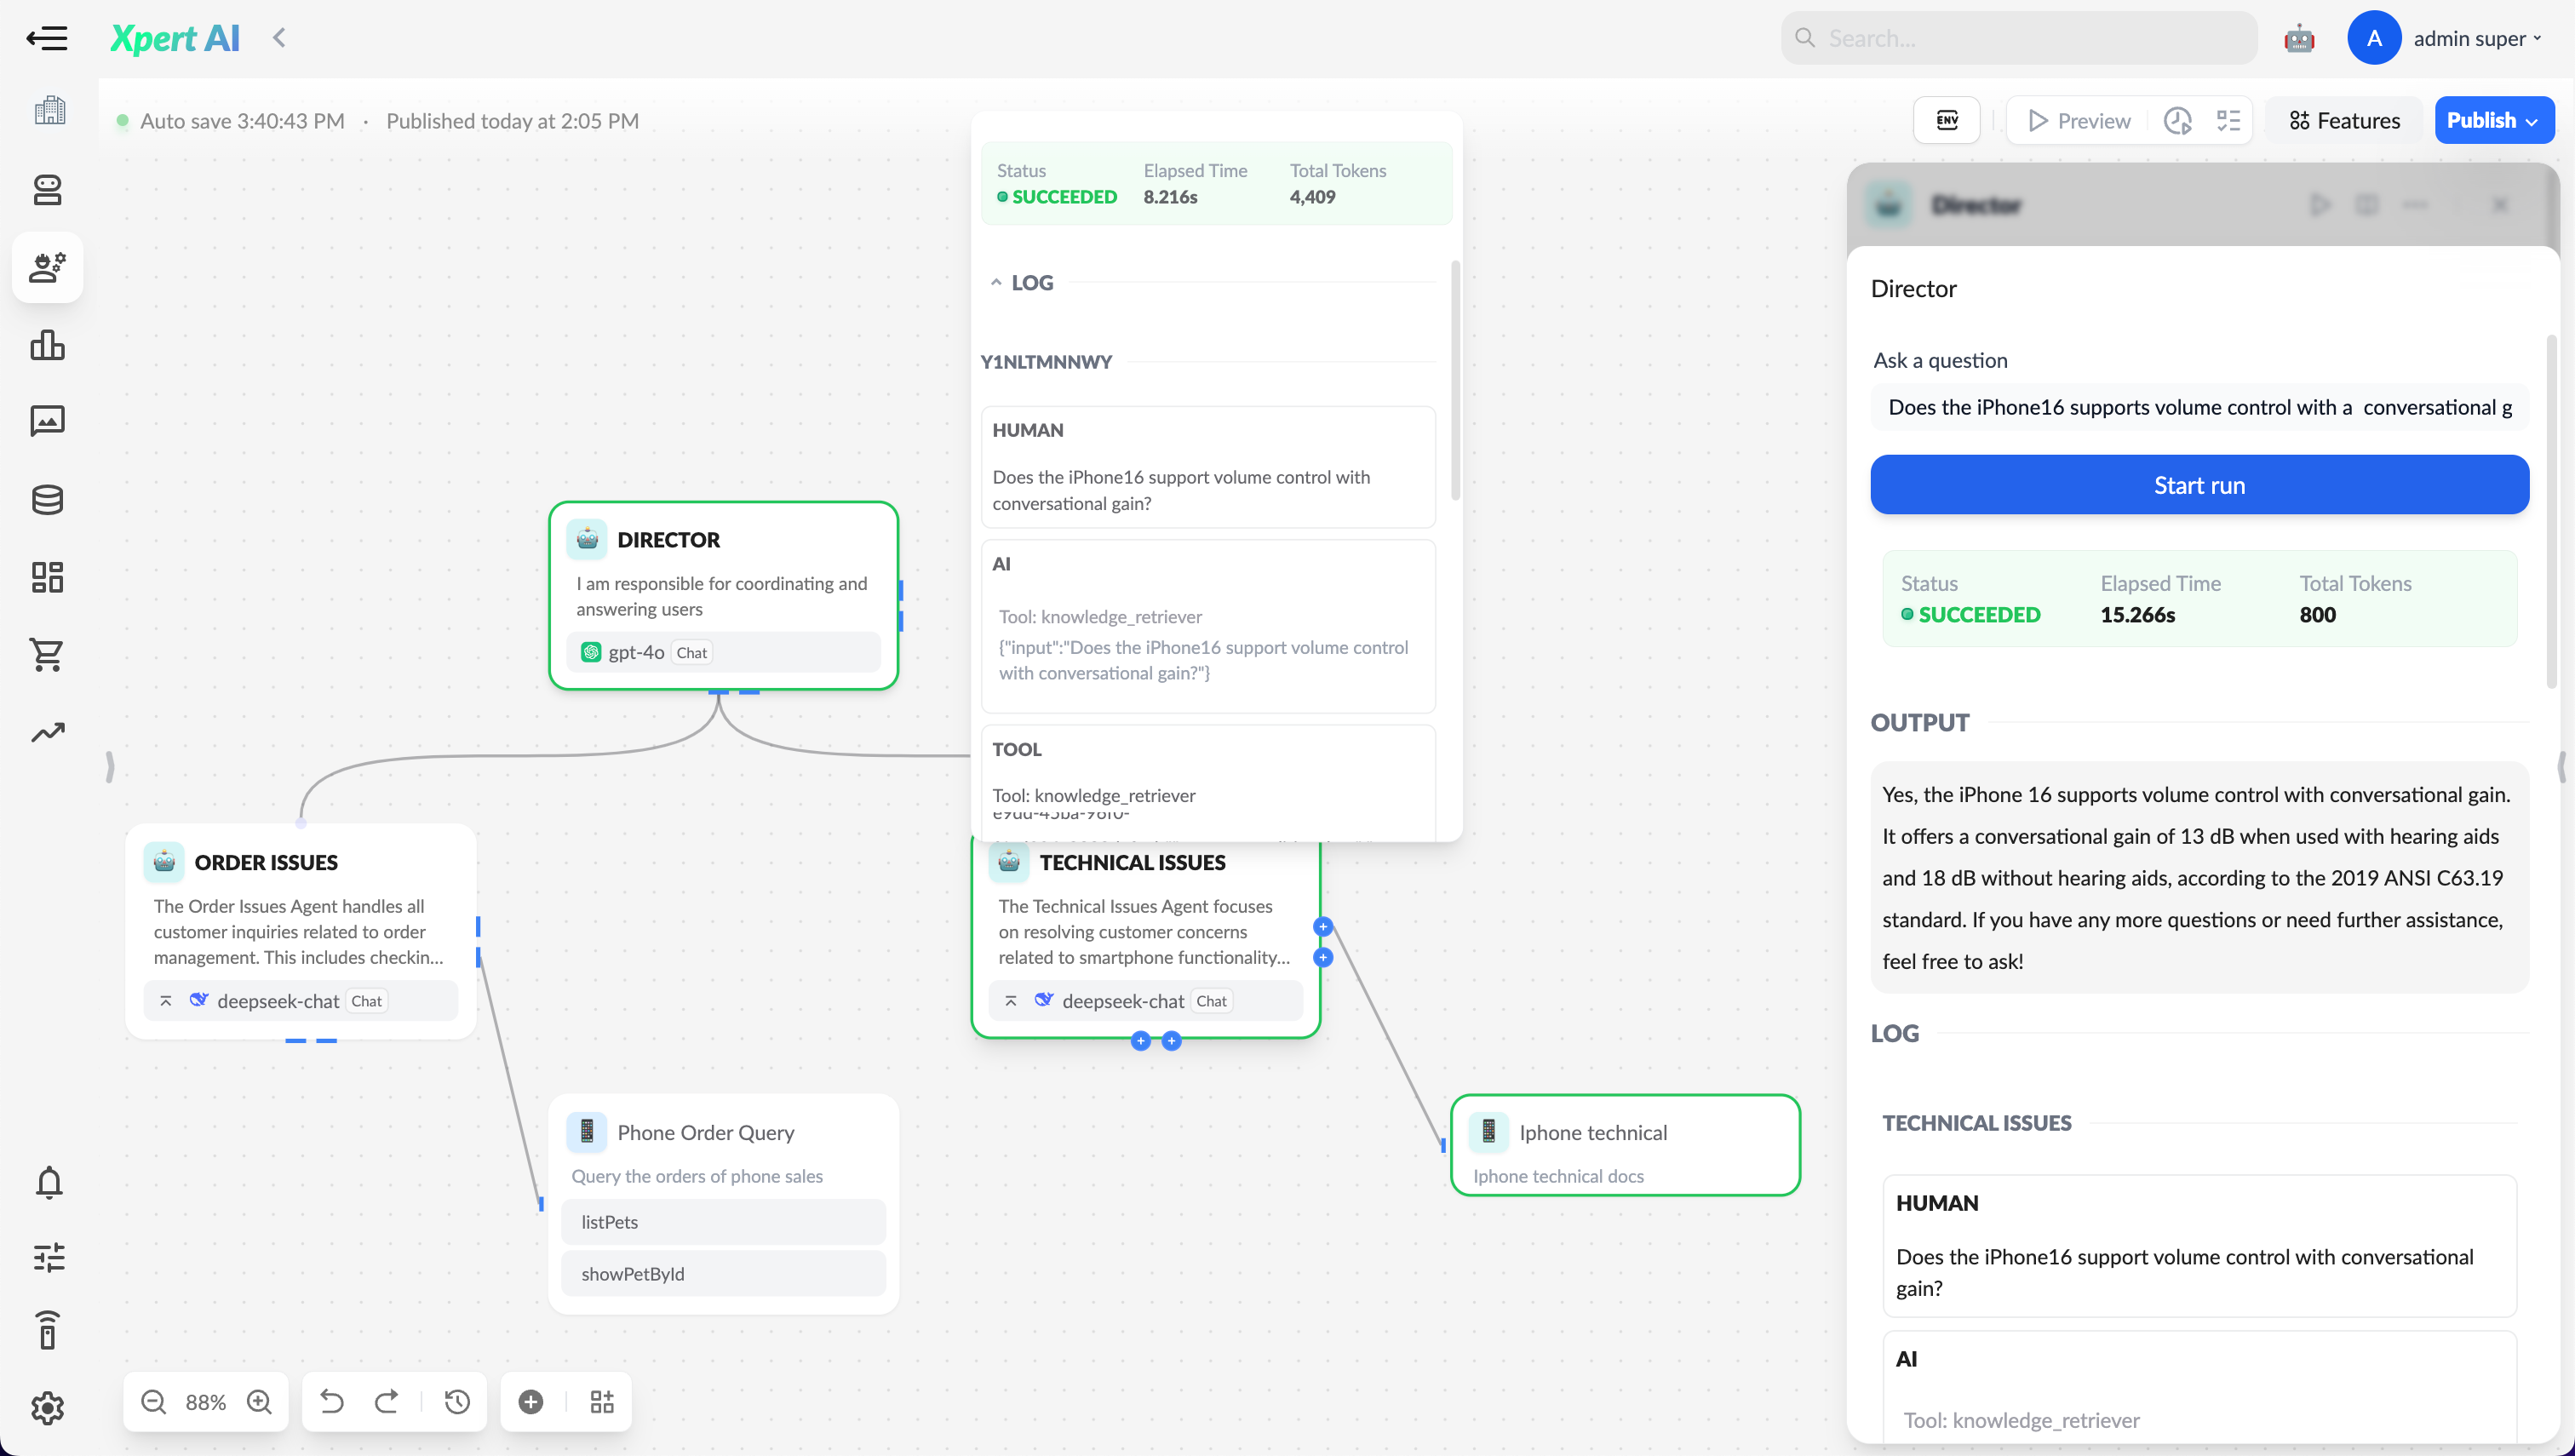
In today's rapidly evolving technological era, artificial intelligence (AI) is gradually transforming our lives and work. The release of the Xpert AI platform v3.0 marks another significant advancement in this field. This update introduces the Agent Orchestration Platform, allowing enterprises to better manage and utilize AI agents, thereby enhancing the automation and efficiency of business processes.
We are excited to announce the official release of version 2.7 GitHub of the Xpert Analytics Platform! This version introduces four exciting new features aimed at further enhancing user interactions and data analysis experiences. These new features include a brand-new Digital Expert role, a flexible and efficient Knowledge Base system, a powerful Toolsets, and support for Multi-Bots of Feishu in ChatBI. This article will detail how these new features can help you manage data more intelligently and improve work efficiency.
We have added the ER diagram feature to the cube designer. You can now view the data relationship model of cubes through the ER diagram, including fact tables, dimensions, measures, and relationships. This allows you to intuitively understand the data structure of cubes, facilitating data modeling and analysis.
We have released version 2.1.0, with the following major updates:
Upgraded the state management framework, using @ngneat/elf, a reactive immutable state management solution.
Upgraded the state management framework of the semantic model module, making semantic model operations more stable, and supporting State History and Undo/Redo functions. Refer to Shortcuts - Modeling Workspace
Upgraded the state management framework of the story module, supporting State History and Undo/Redo functions. Refer to Shortcuts - Story Preferences
Changed olap data request method from Http requests to Websocket requests, improving the efficiency of data concurrent queries. Refer to WebSocket Request - Server Agent
We are excited to announce that the SaaS data analytics platform, Xpert Analytics Cloud, from the Xpert Analytics Cloud team, is now open source! This is a significant milestone, and we take pride in our ability to collaborate with the global developer community to drive innovation in the field of data analytics.
In this article, we will introduce some basic information about Xpert Analytics Cloud and how you can join our community to contribute to the development of the data analytics field.
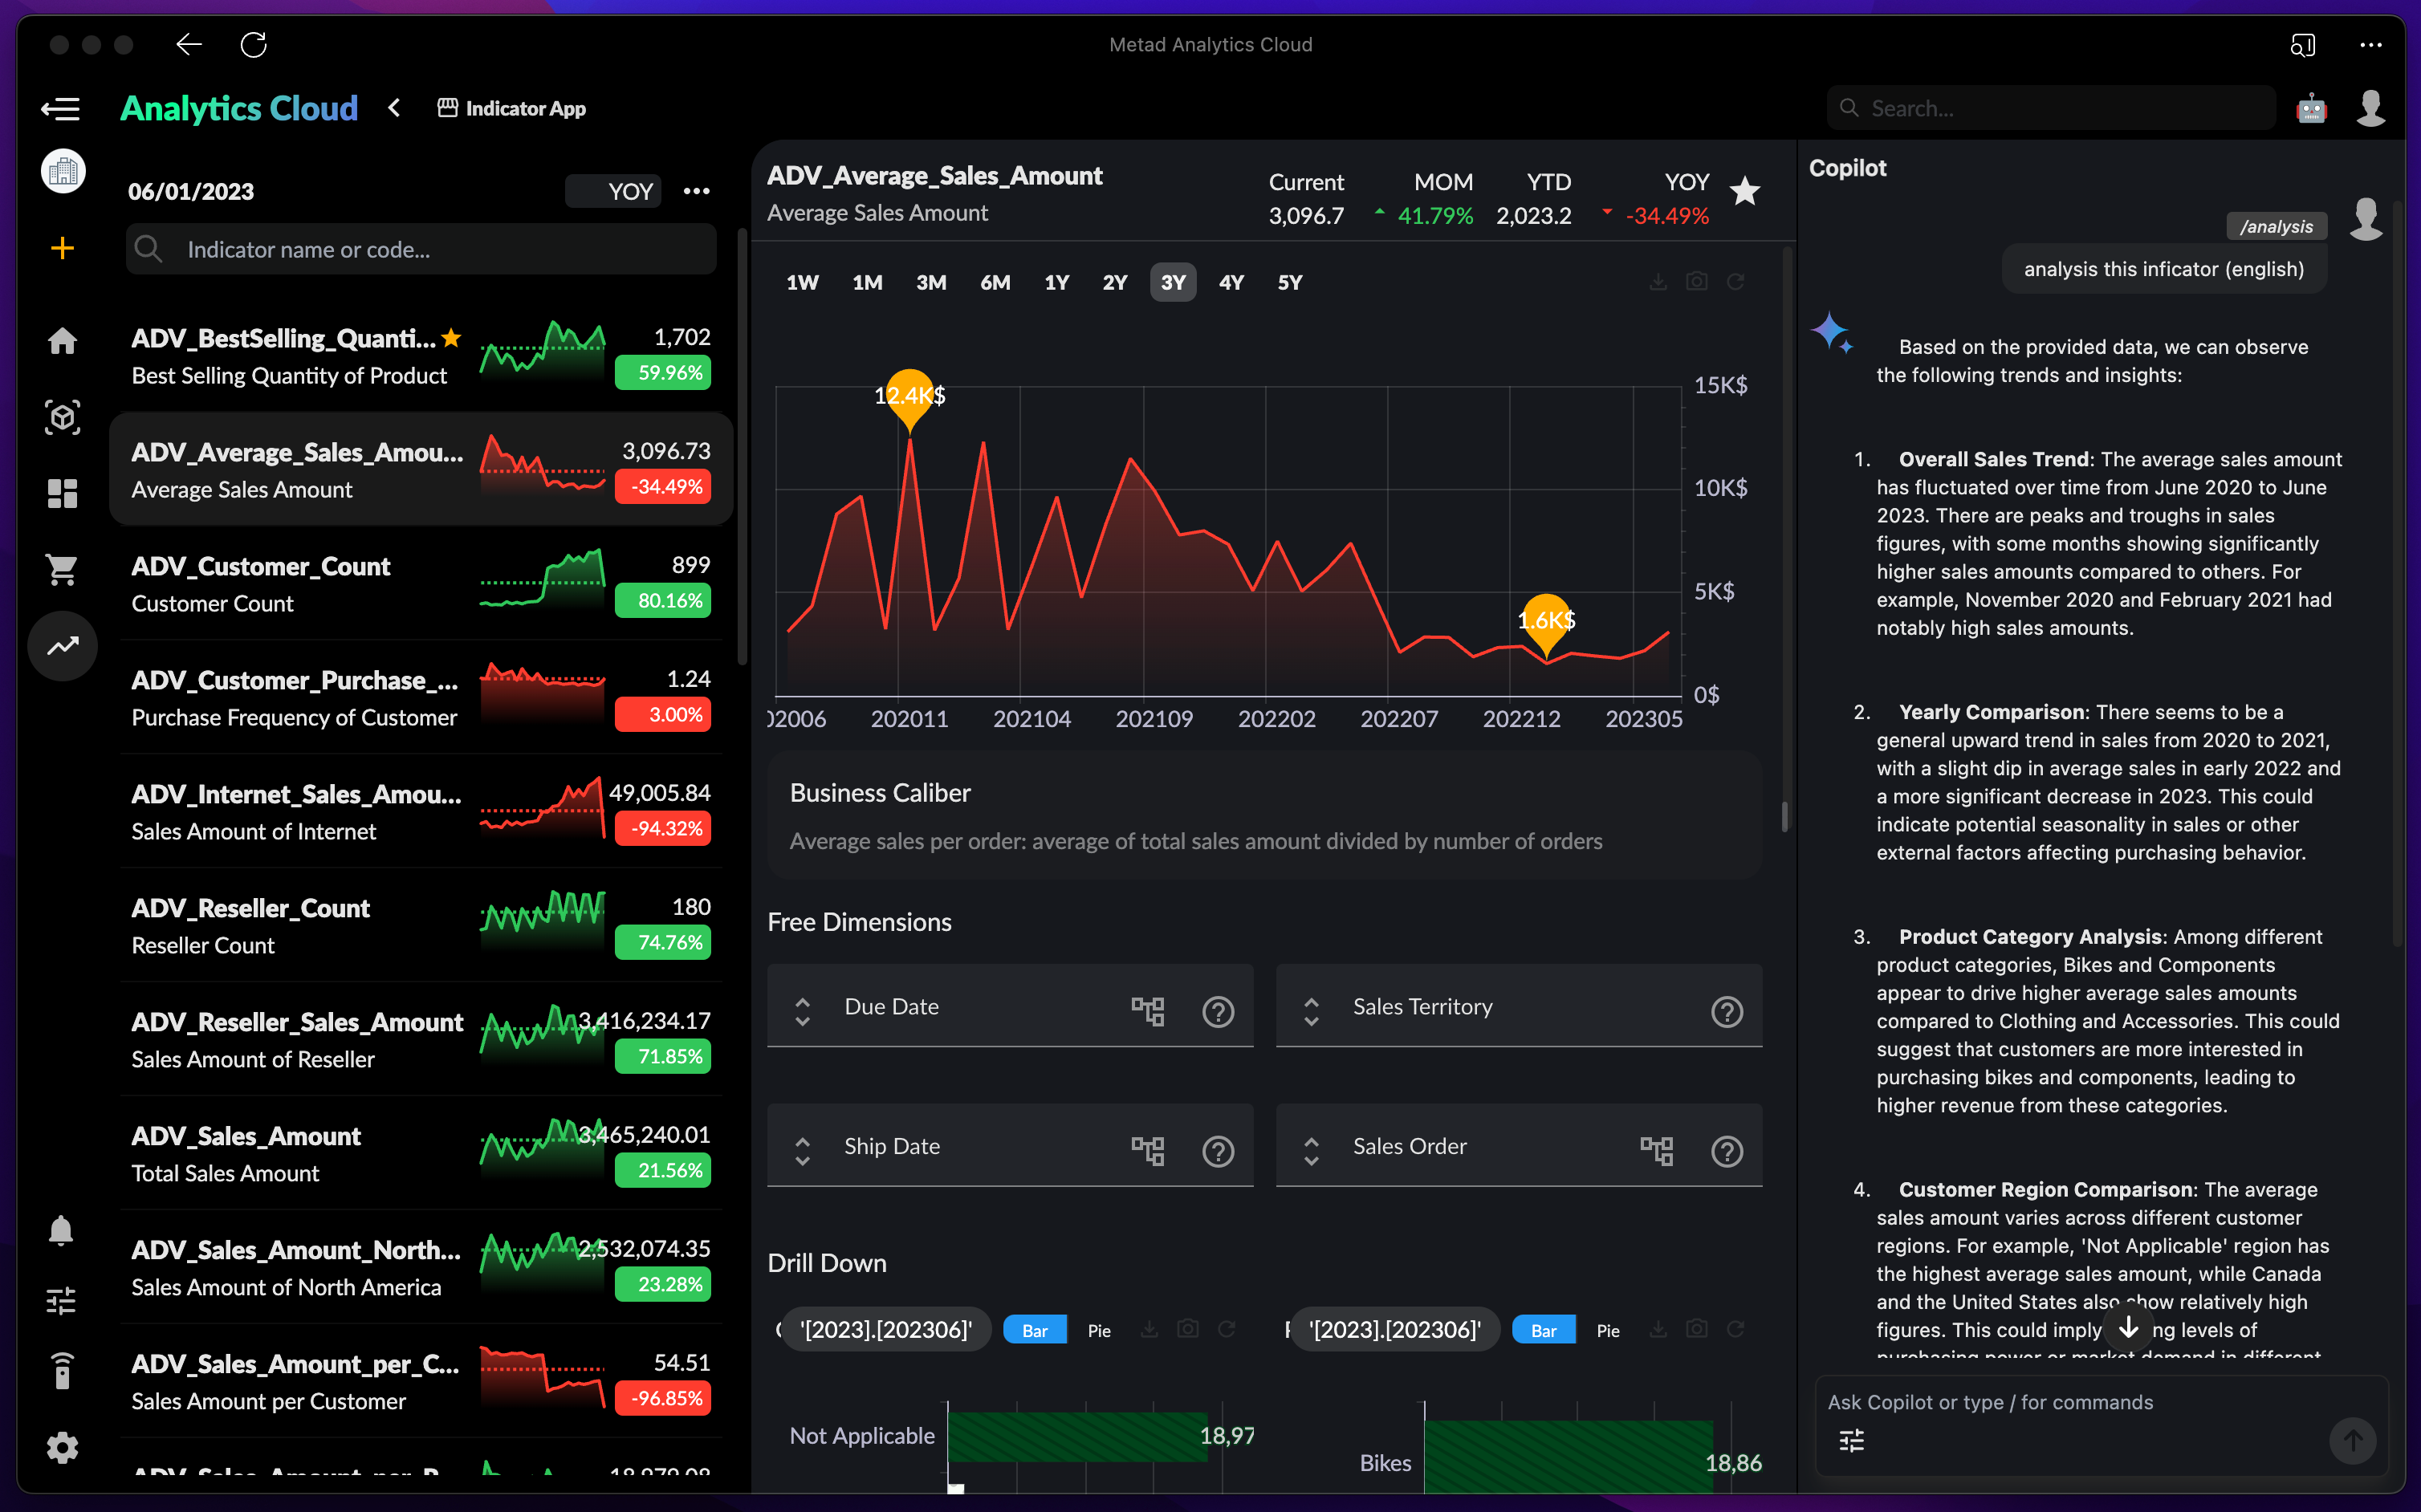
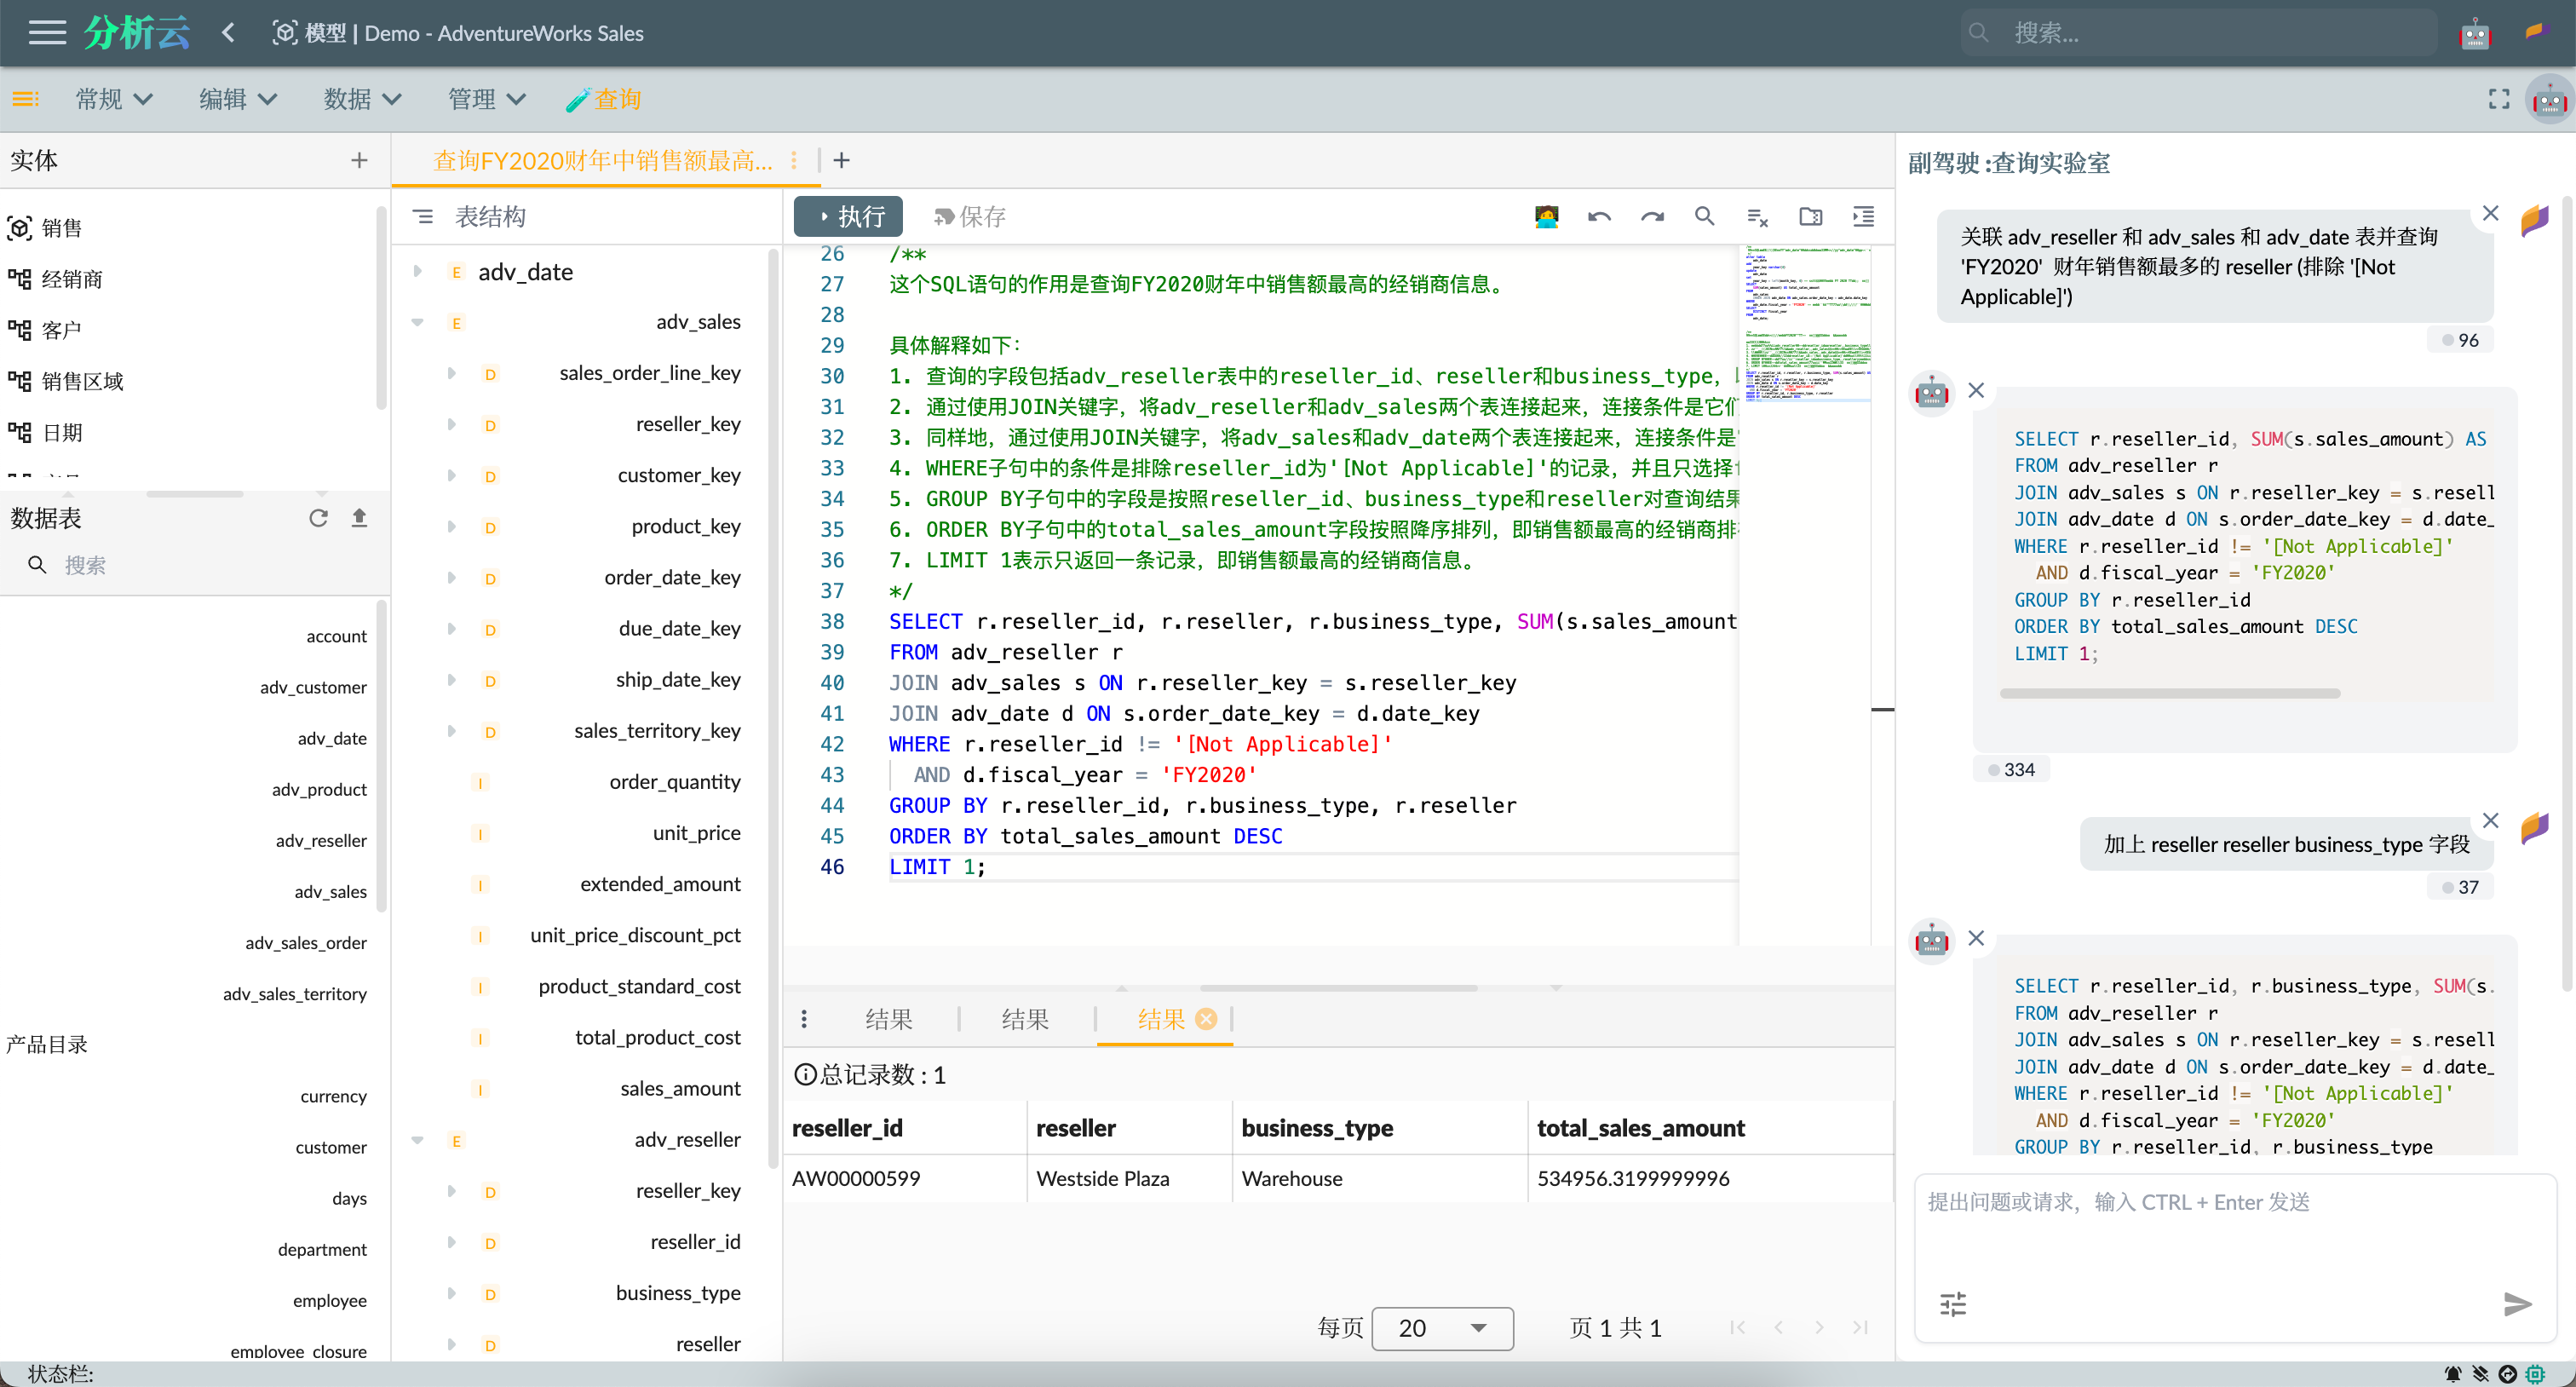
In today's data-driven business environment, data analysis has become a key part of business decision-making. The Xpert Analytics Cloud provides you with an intelligent data query experience, through its powerful AI copilot function based on ChatGPT, you can more efficiently query, optimize and interpret data. This article will introduce in detail how to turn on and configure the AI copilot in the Xpert Analytics Cloud, and how to use the AI copilot in the Query Lab to improve the efficiency of data query.
Query Lab provides the function of flexibly operating the data source entity (physical table view or multi-dimensional data set) by using SQL query statement, which helps users in their daily data operation and maintenance work. The query lab is built in the semantic model workspace and operates and queries data through the data sources connected by the semantic model. If the user's data source is public network accessible, you can create a data source in the Xpert analytics cloud to connect query. If the user's data source is deployed in the private network, you can use the desktop agent to connect and query.
Query Lab AI Copilot
Next, this article will introduce how to turn on and configure AI copilot and use it to assist in querying the data sql in the laboratory, optimizing and explaining.
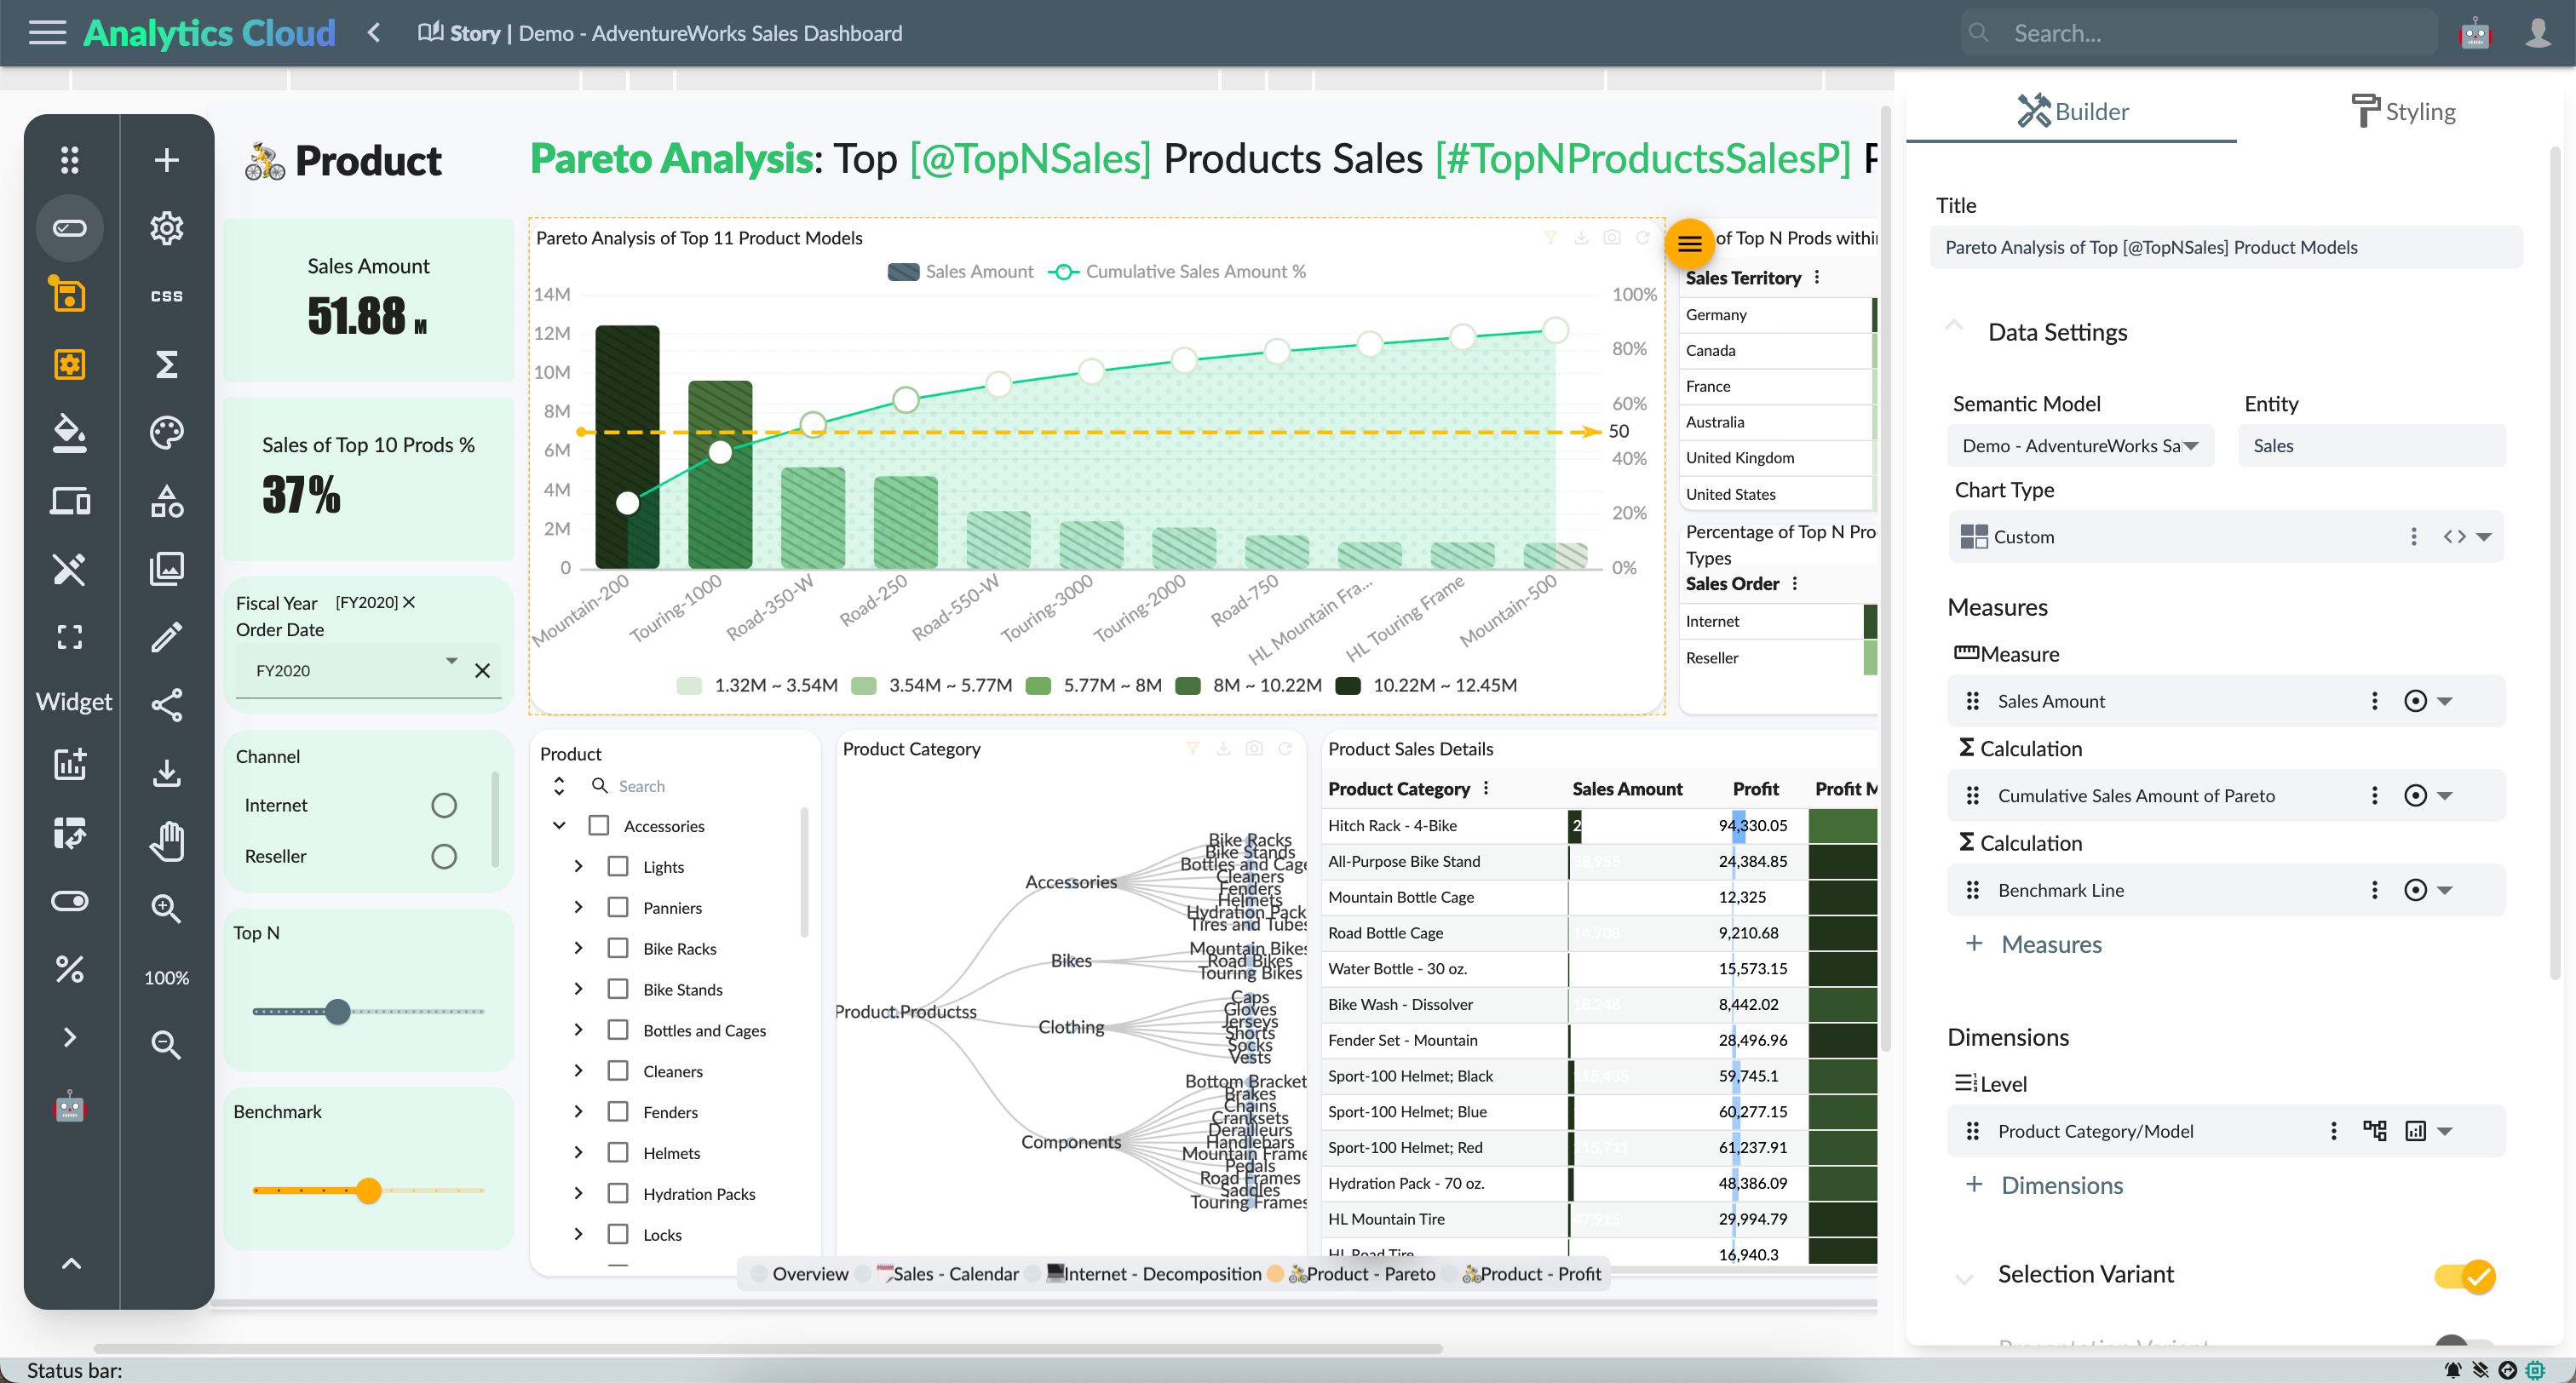
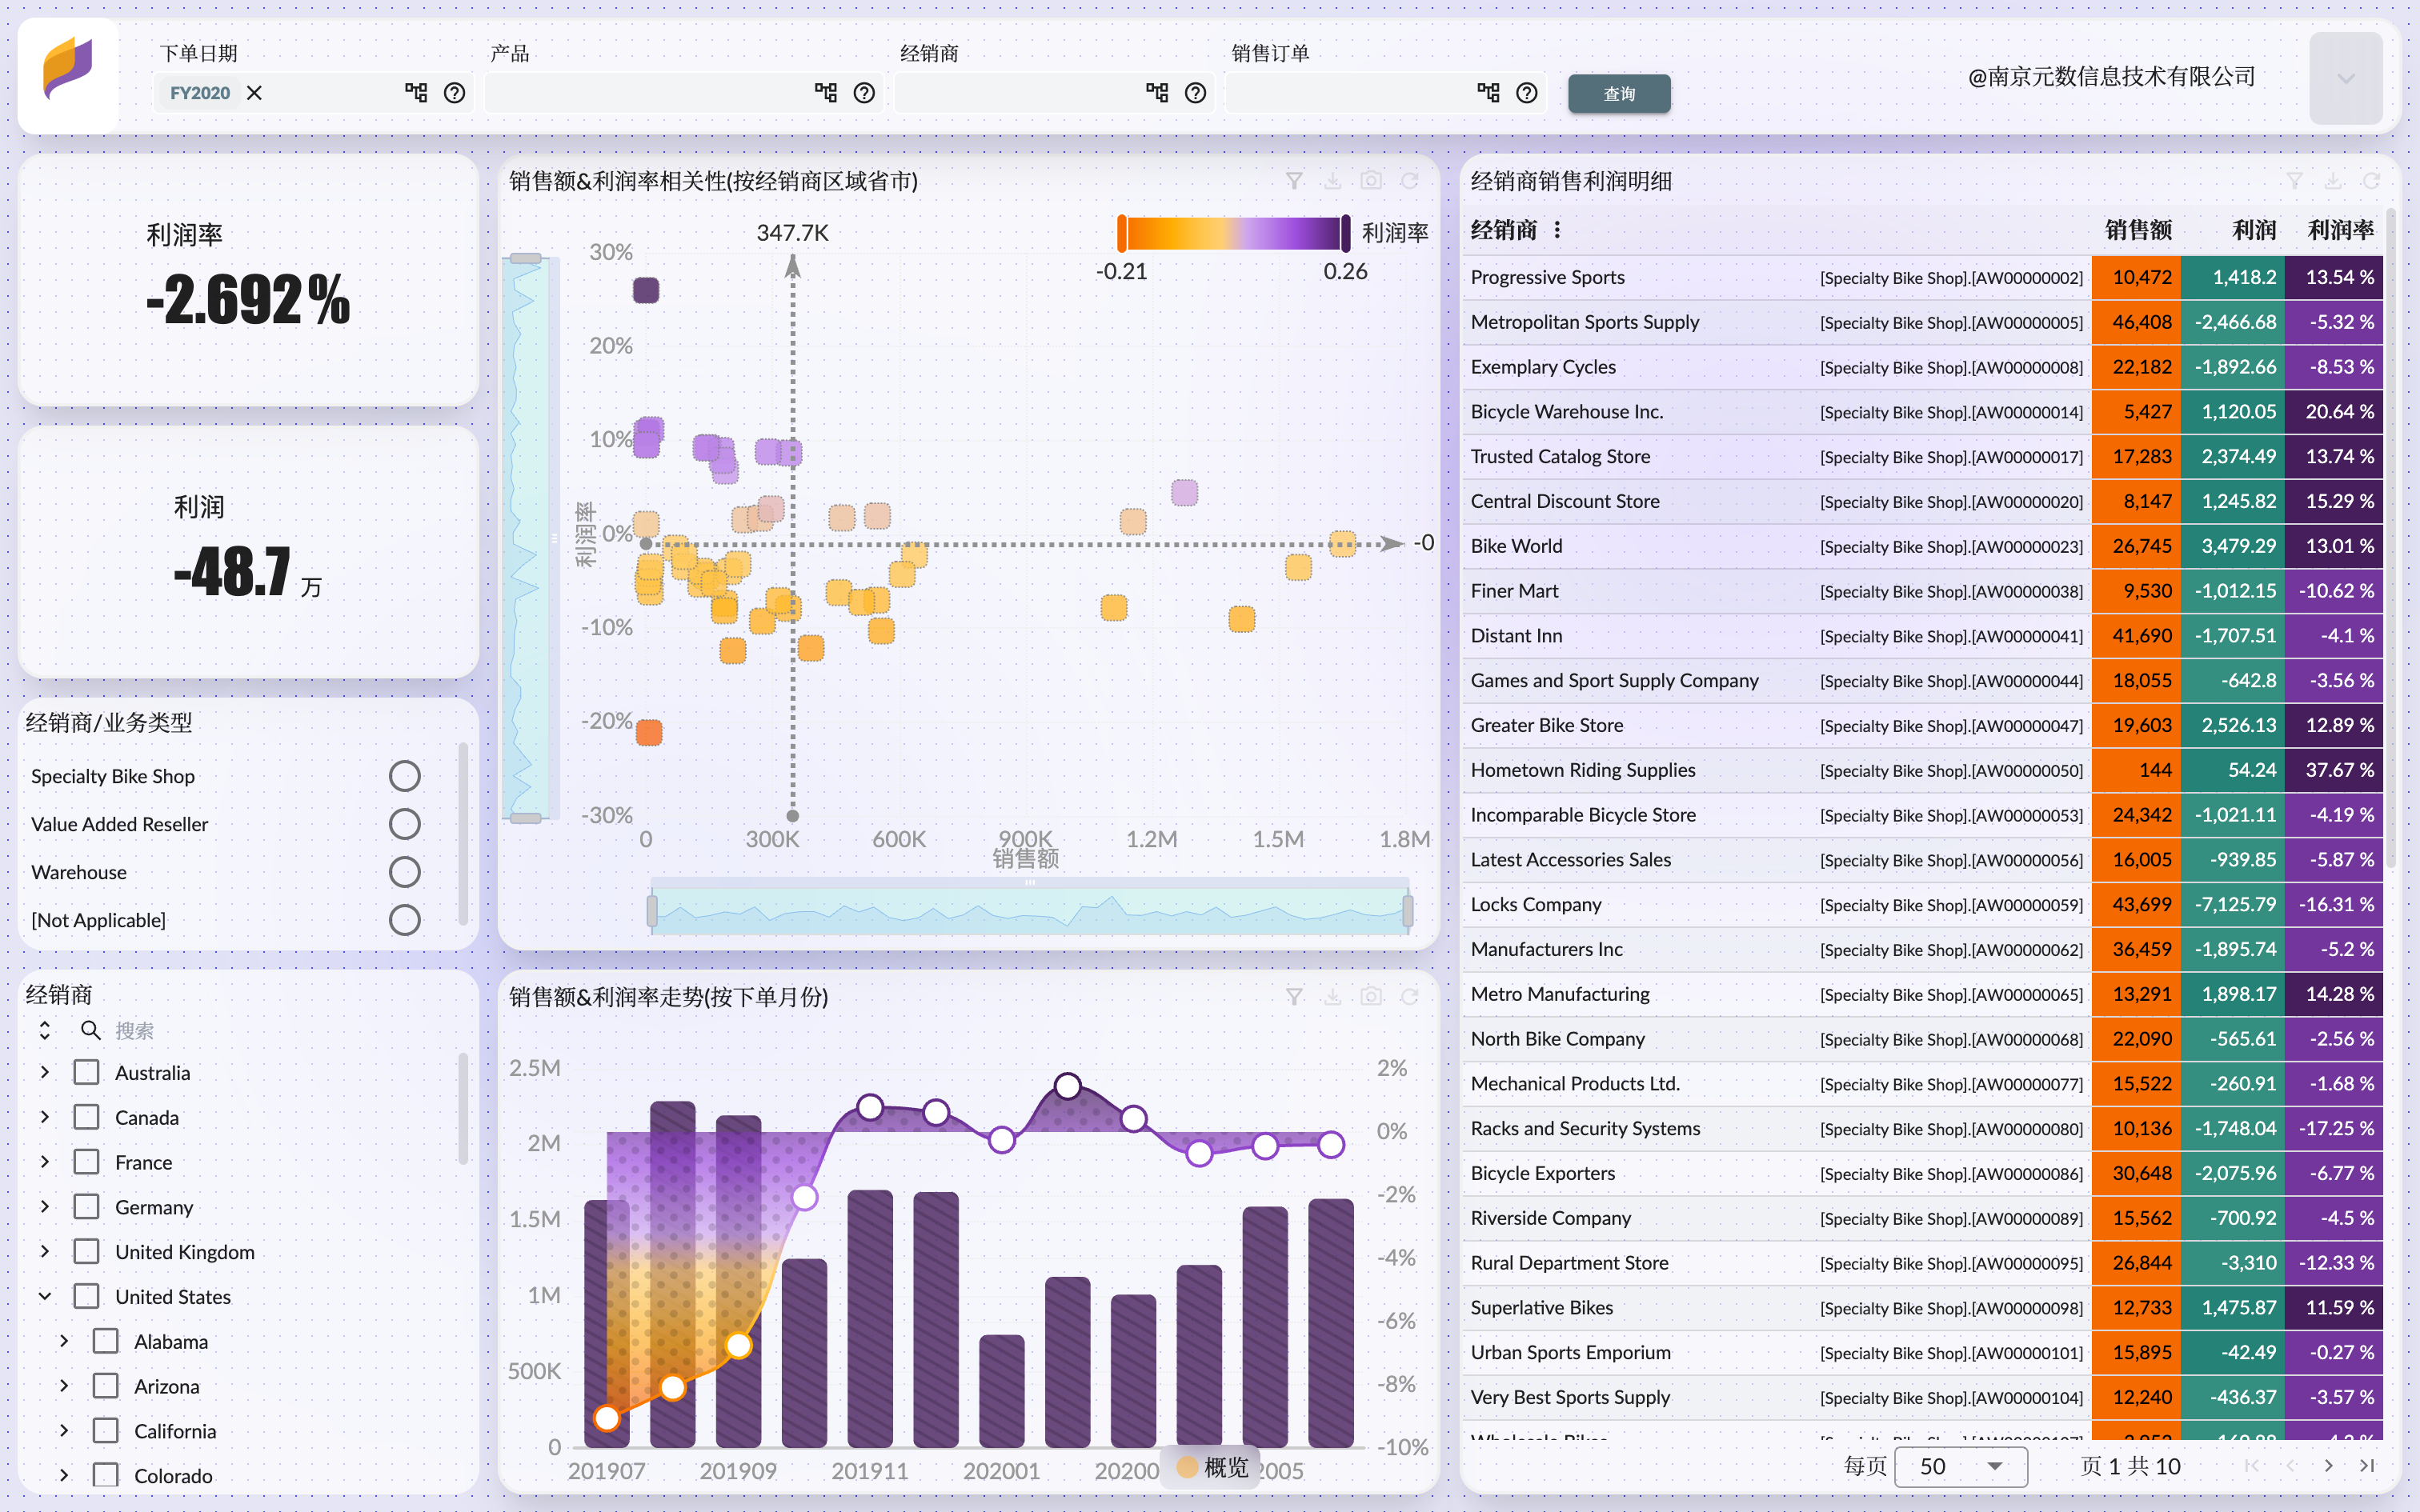
Welcome back to the AdventureWorks Sales sample series! Today we will continue to explore this Xpert powerful BI software, focusing on the theme template function. Through the theme template, you can create, share and apply story dashboard templates more efficiently, thus quickly revealing insights in the data.
The dashboard theme template is usually designed to cover multiple aspects, aiming to provide users with a convenient and efficient way to create consistent and professional data analysis dashboards. Here are some of the common content that dashboard theme templates may include:
Color and style settings: Provides predefined color schemes and styles, allowing users to easily select colors and styles that suit their analytic themes.
Font and text style: Allows users to select different fonts, sizes, and styles to ensure that the report content is easy to read and consistent with the corporate brand.
Chart template: Provides different types of chart templates, such as bar charts, line charts, pie charts, etc. Users can insert these charts directly and adjust the data source as needed.
Chart style: Allows users to select different chart styles, such as solid, flat, gradient, etc., to make the data more attractive and readable.
Background and border: Provides background image, color or texture options, and can adjust borders and fills to increase the visual appeal of the dashboard.
Logos and Watermarks: Allows users to add company logos, watermarks, or copyright information to protect content and enhance professionalism.
Data table style: Define the appearance of the data table, including the table header, cell color, border, etc., making the table easier to read and understand.
Interactive elements: Predefined interactive elements such as drop-down menus and buttons allow users to customize the interactive experience of the dashboard.
Device adaptation: Provides adaptation options on different devices to ensure the visual effect of the dashboard on different screen sizes.
Template Library Management: Storyboard template library, users can browse, search and select templates that suit their analytical scenarios.