
16 posts tagged with "Xpert"

View All Tags

· 10 min read
Tiven Wang

Welcome back to the AdventureWorks Sales Story series! In this article, we will continue to explore the advanced features of the Story Dashboard, focusing on dynamic parameters and linked analysis between widgets. These features will allow you to dig deeper into the data, discover hidden insights, and take your analysis to a whole new level.

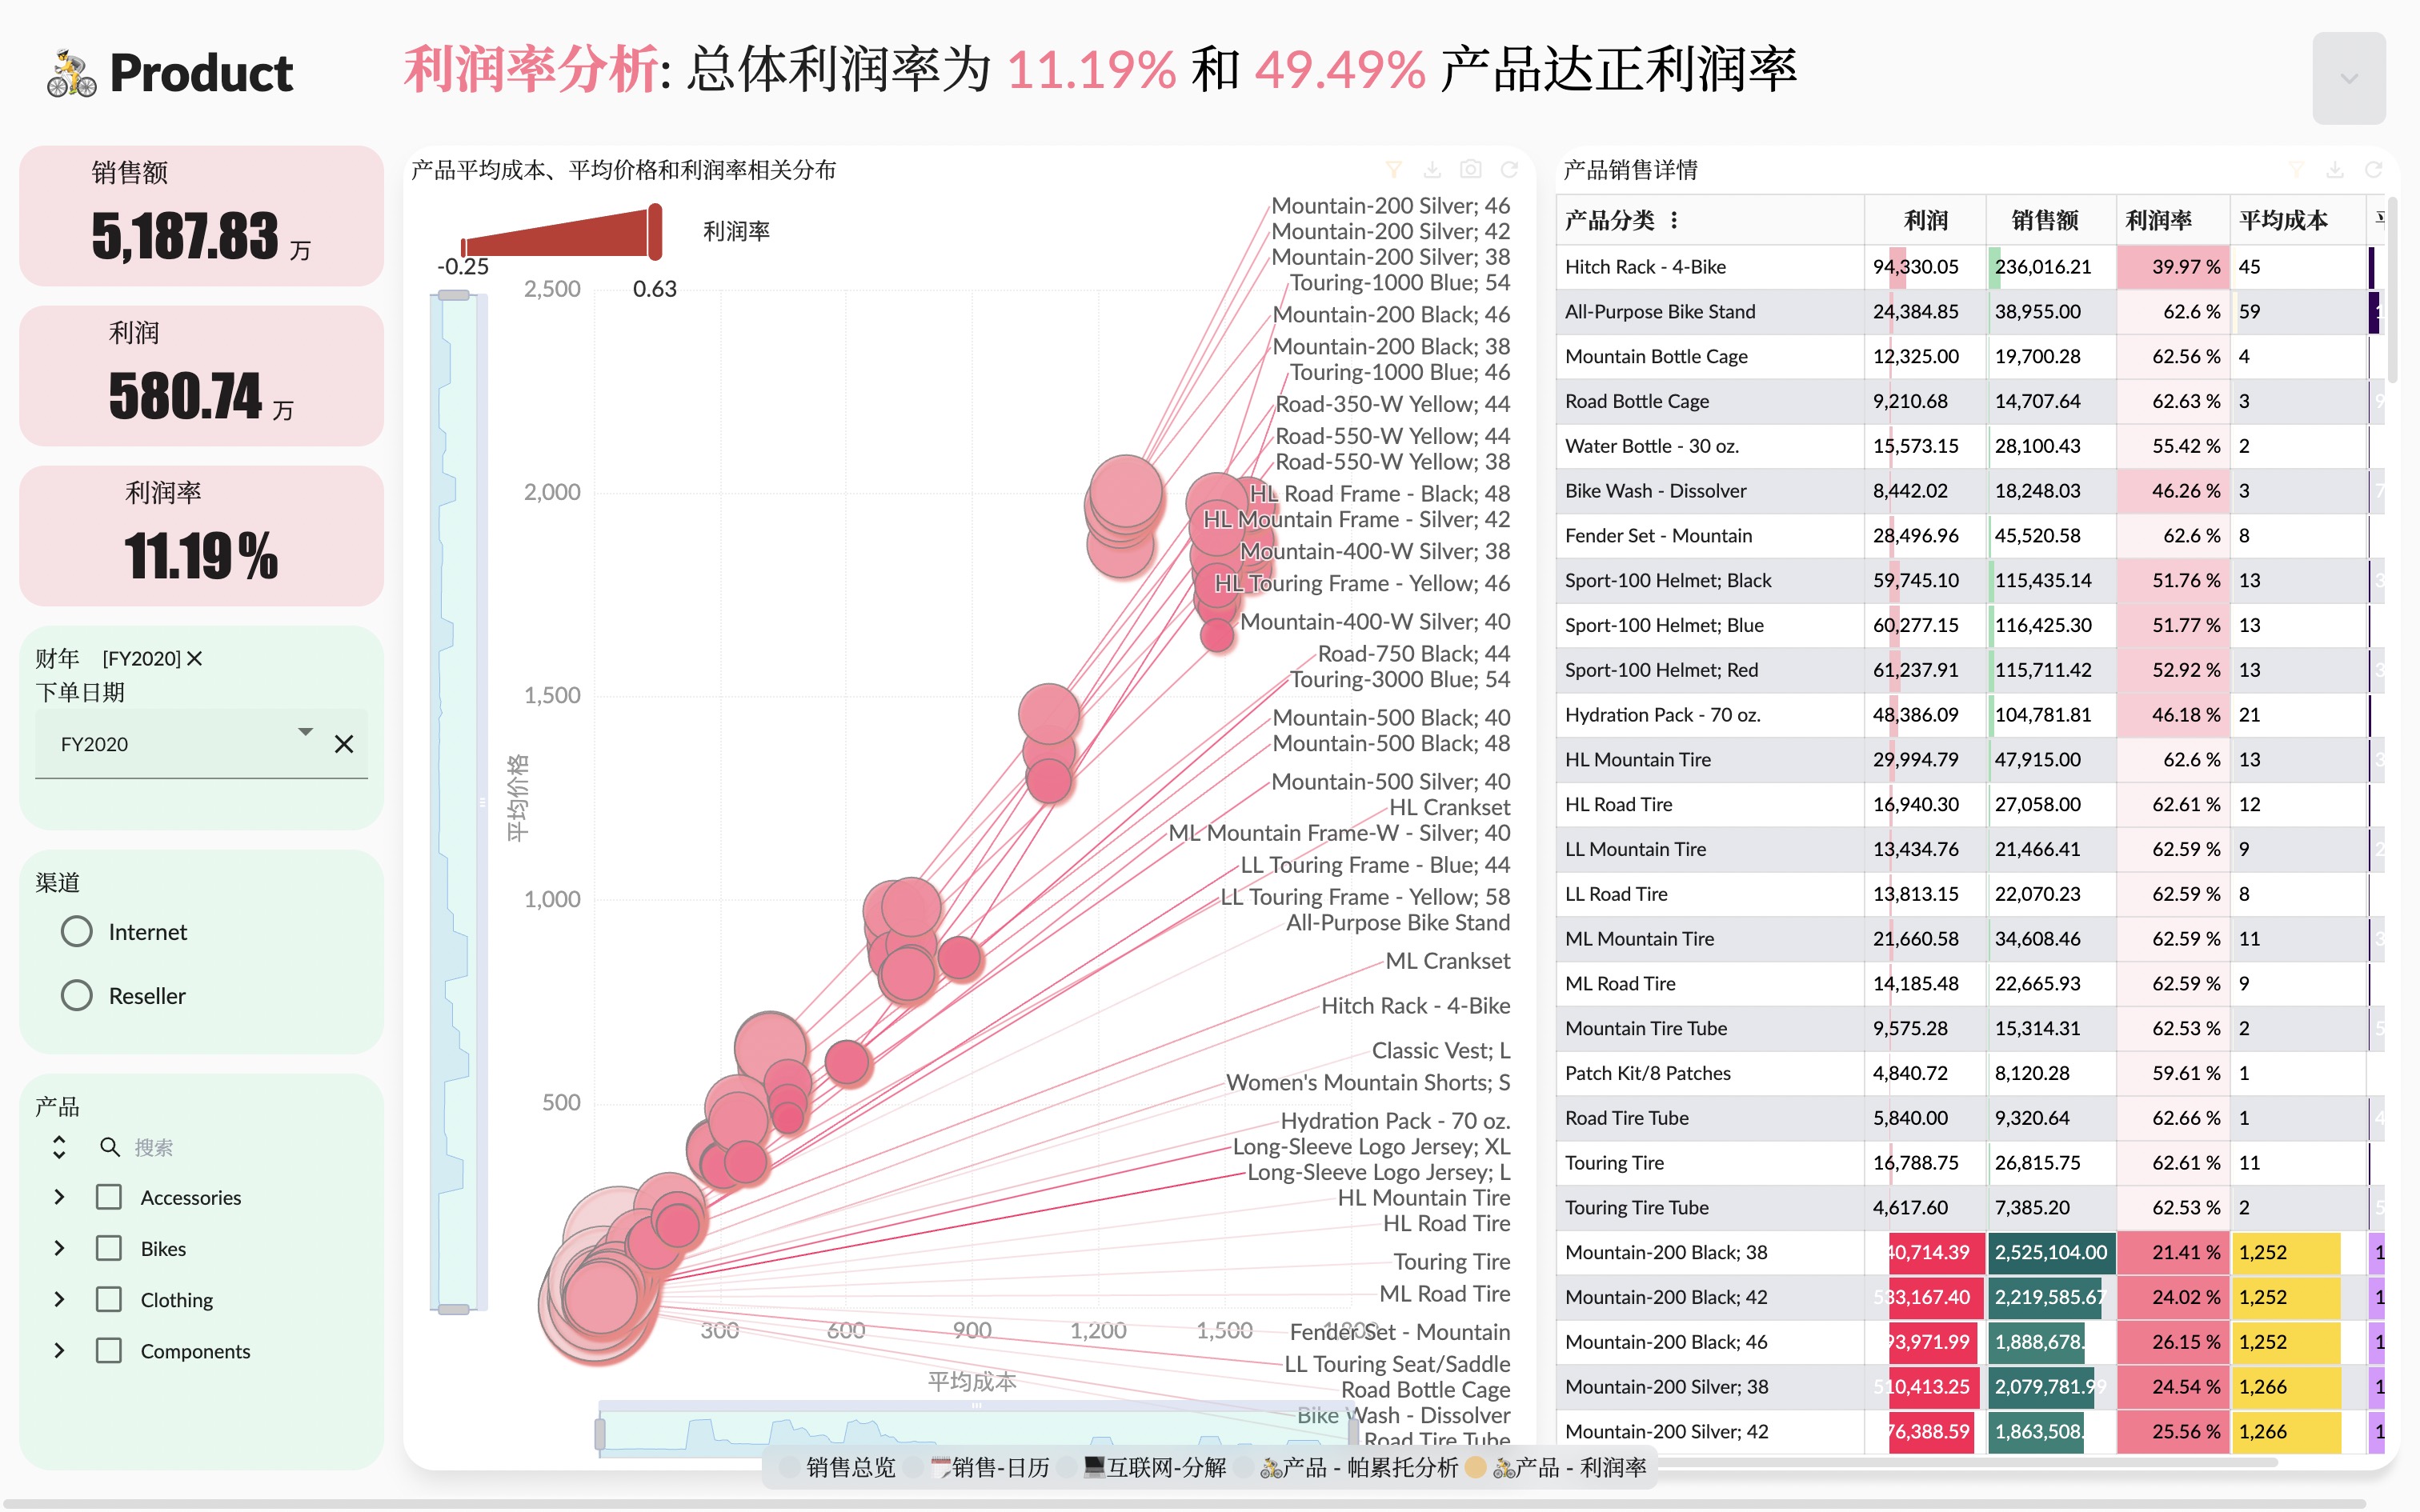
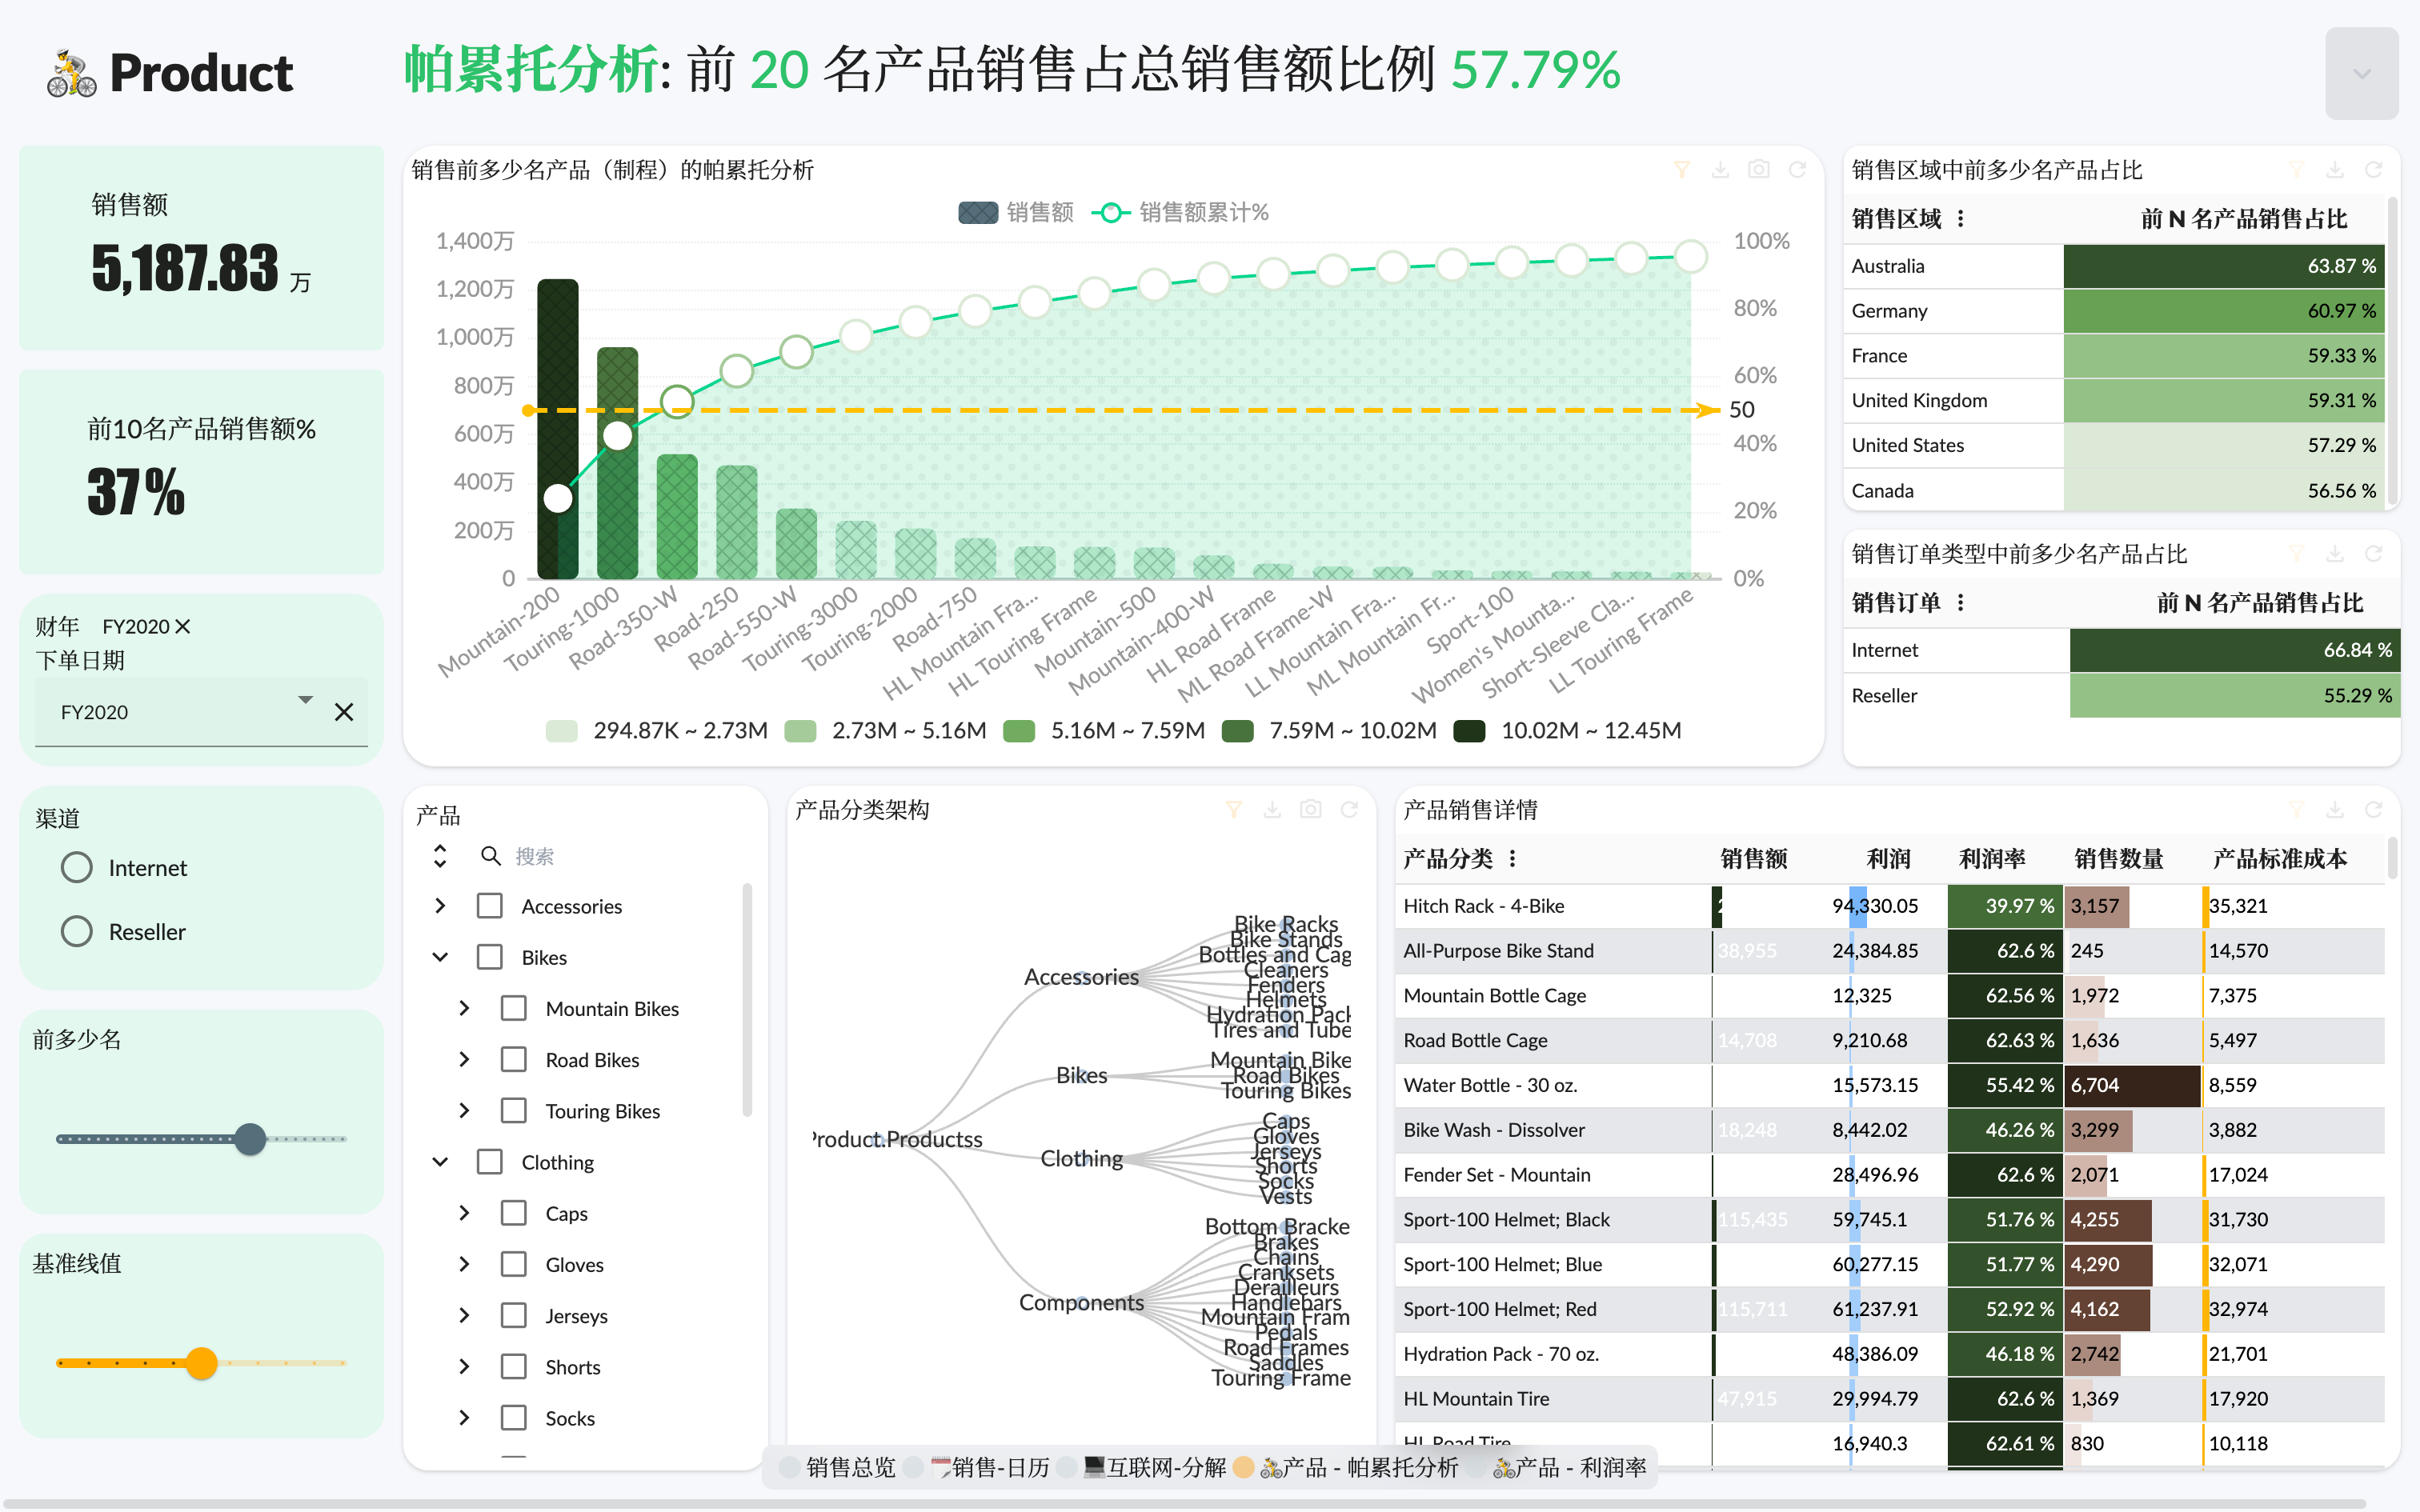
In many cases, we need to focus on the top N products by sales to focus on the most valuable products. With the parameter feature of Xpert analytics cloud, you can easily implement dynamic Pareto analysis.

Product Pareto analysis

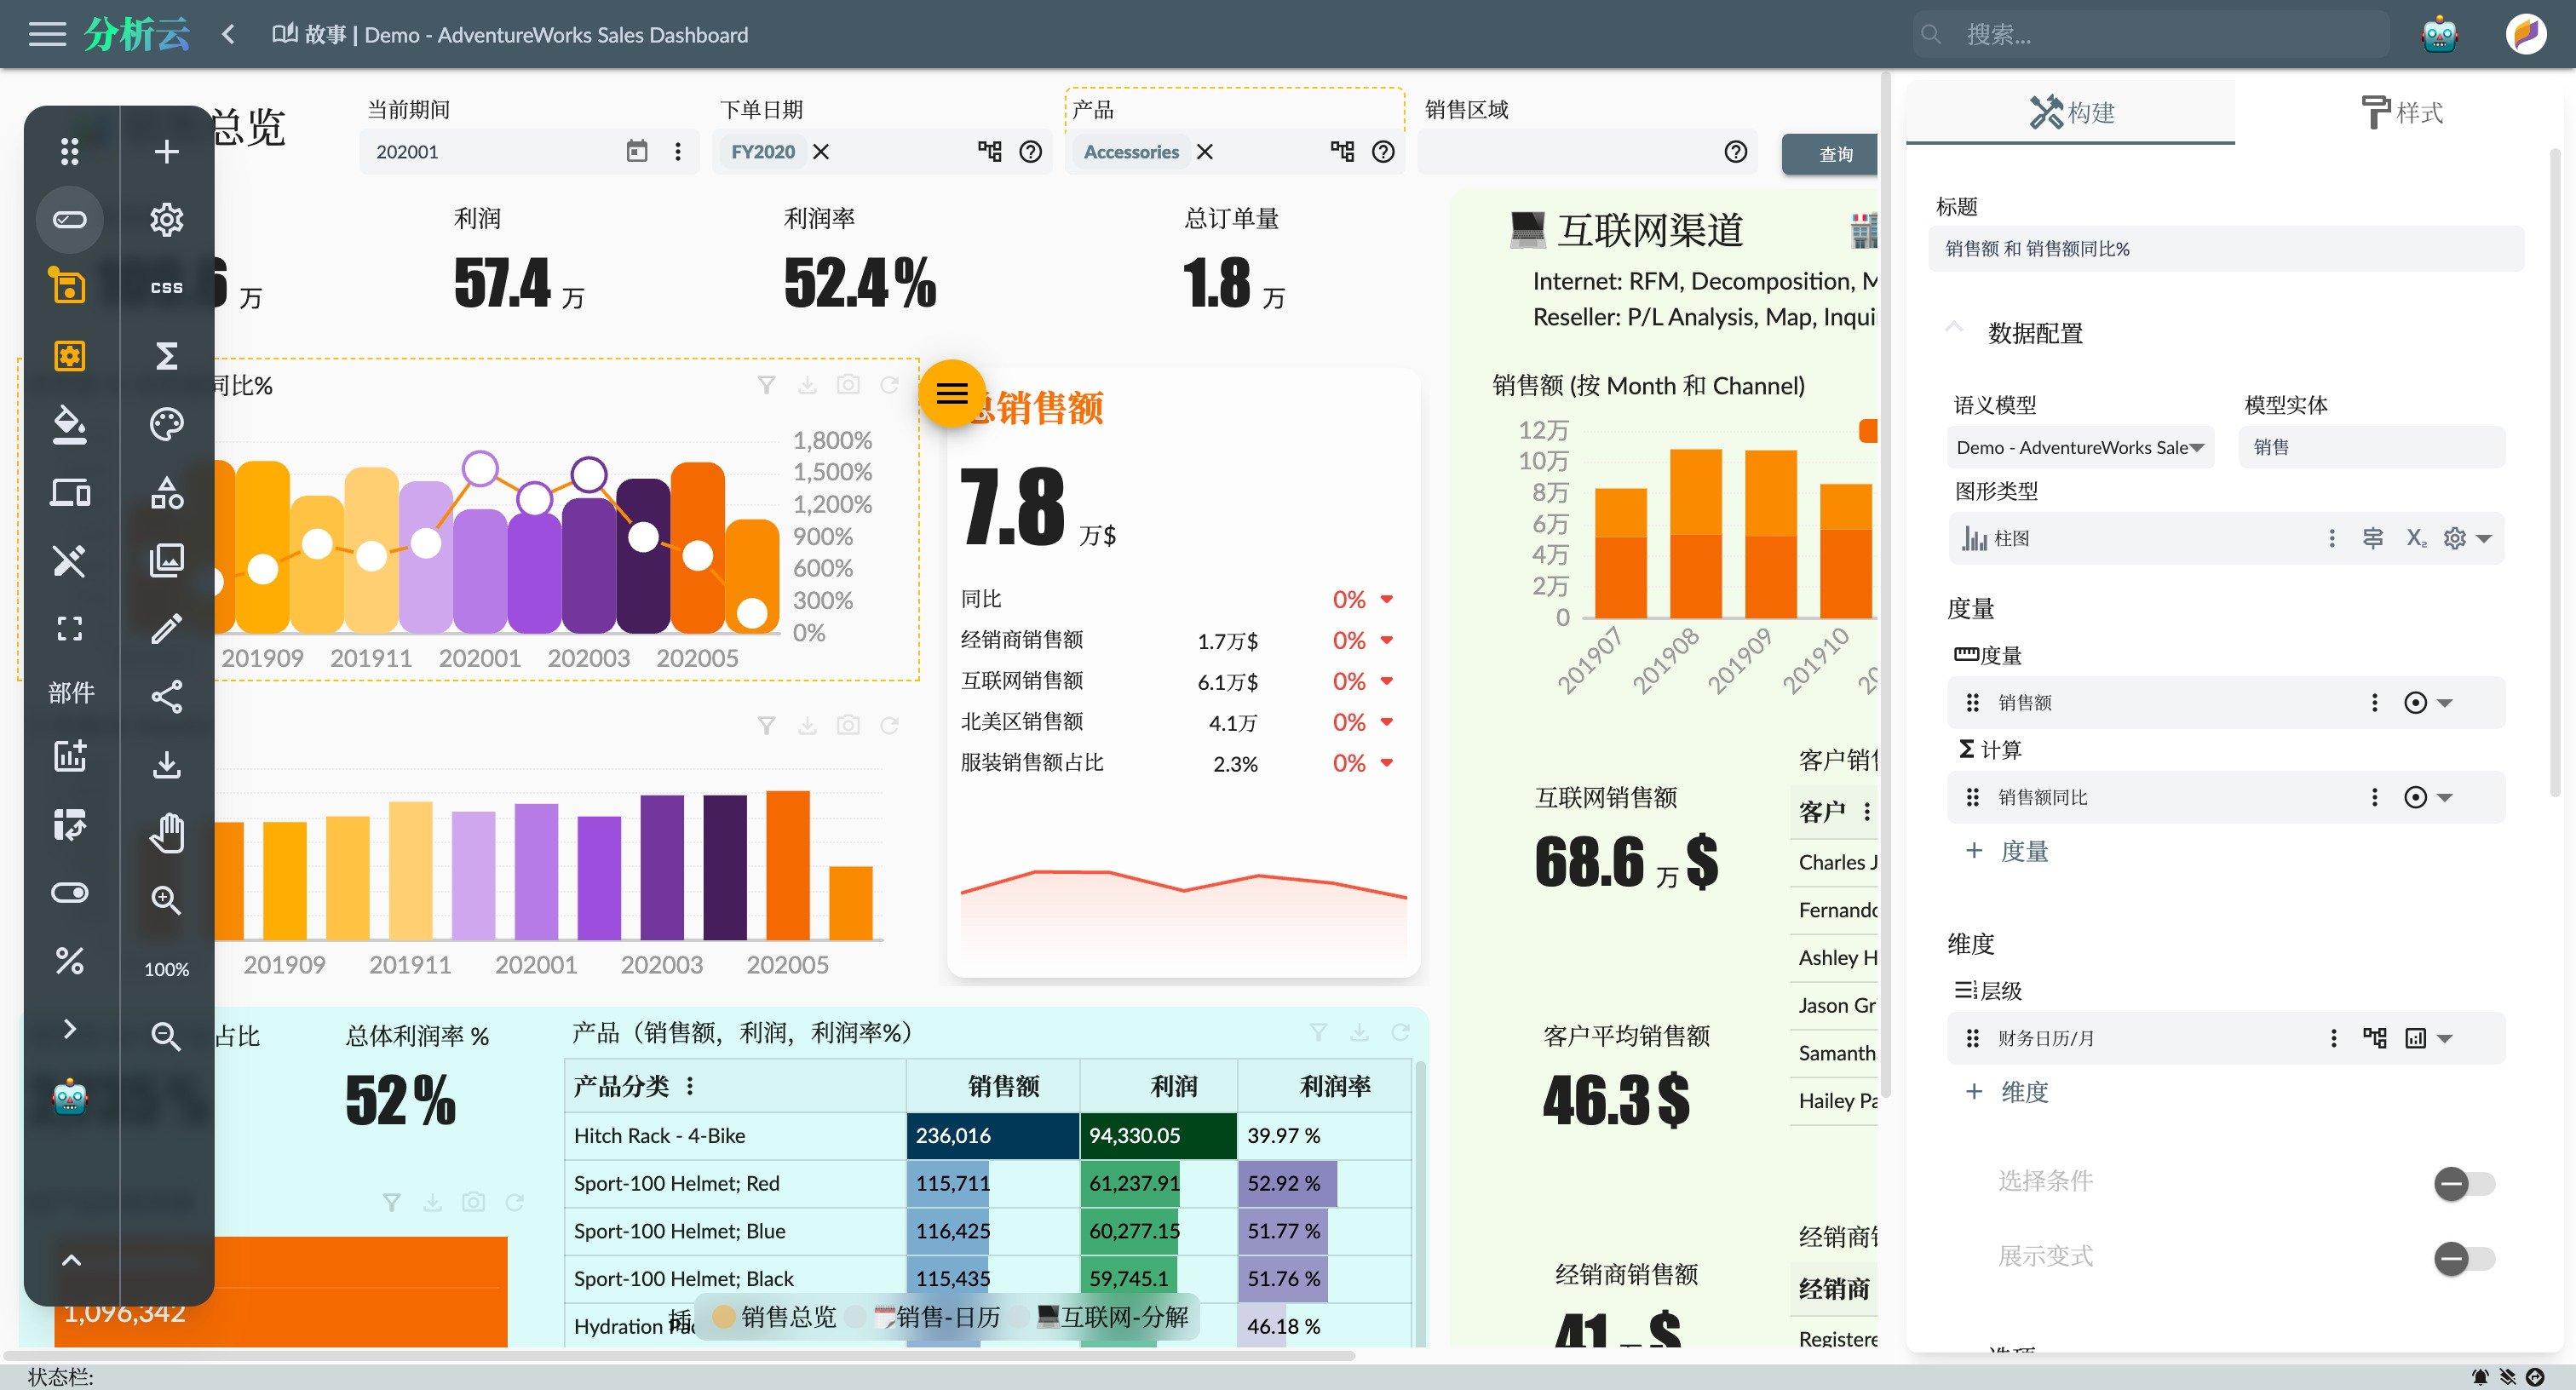
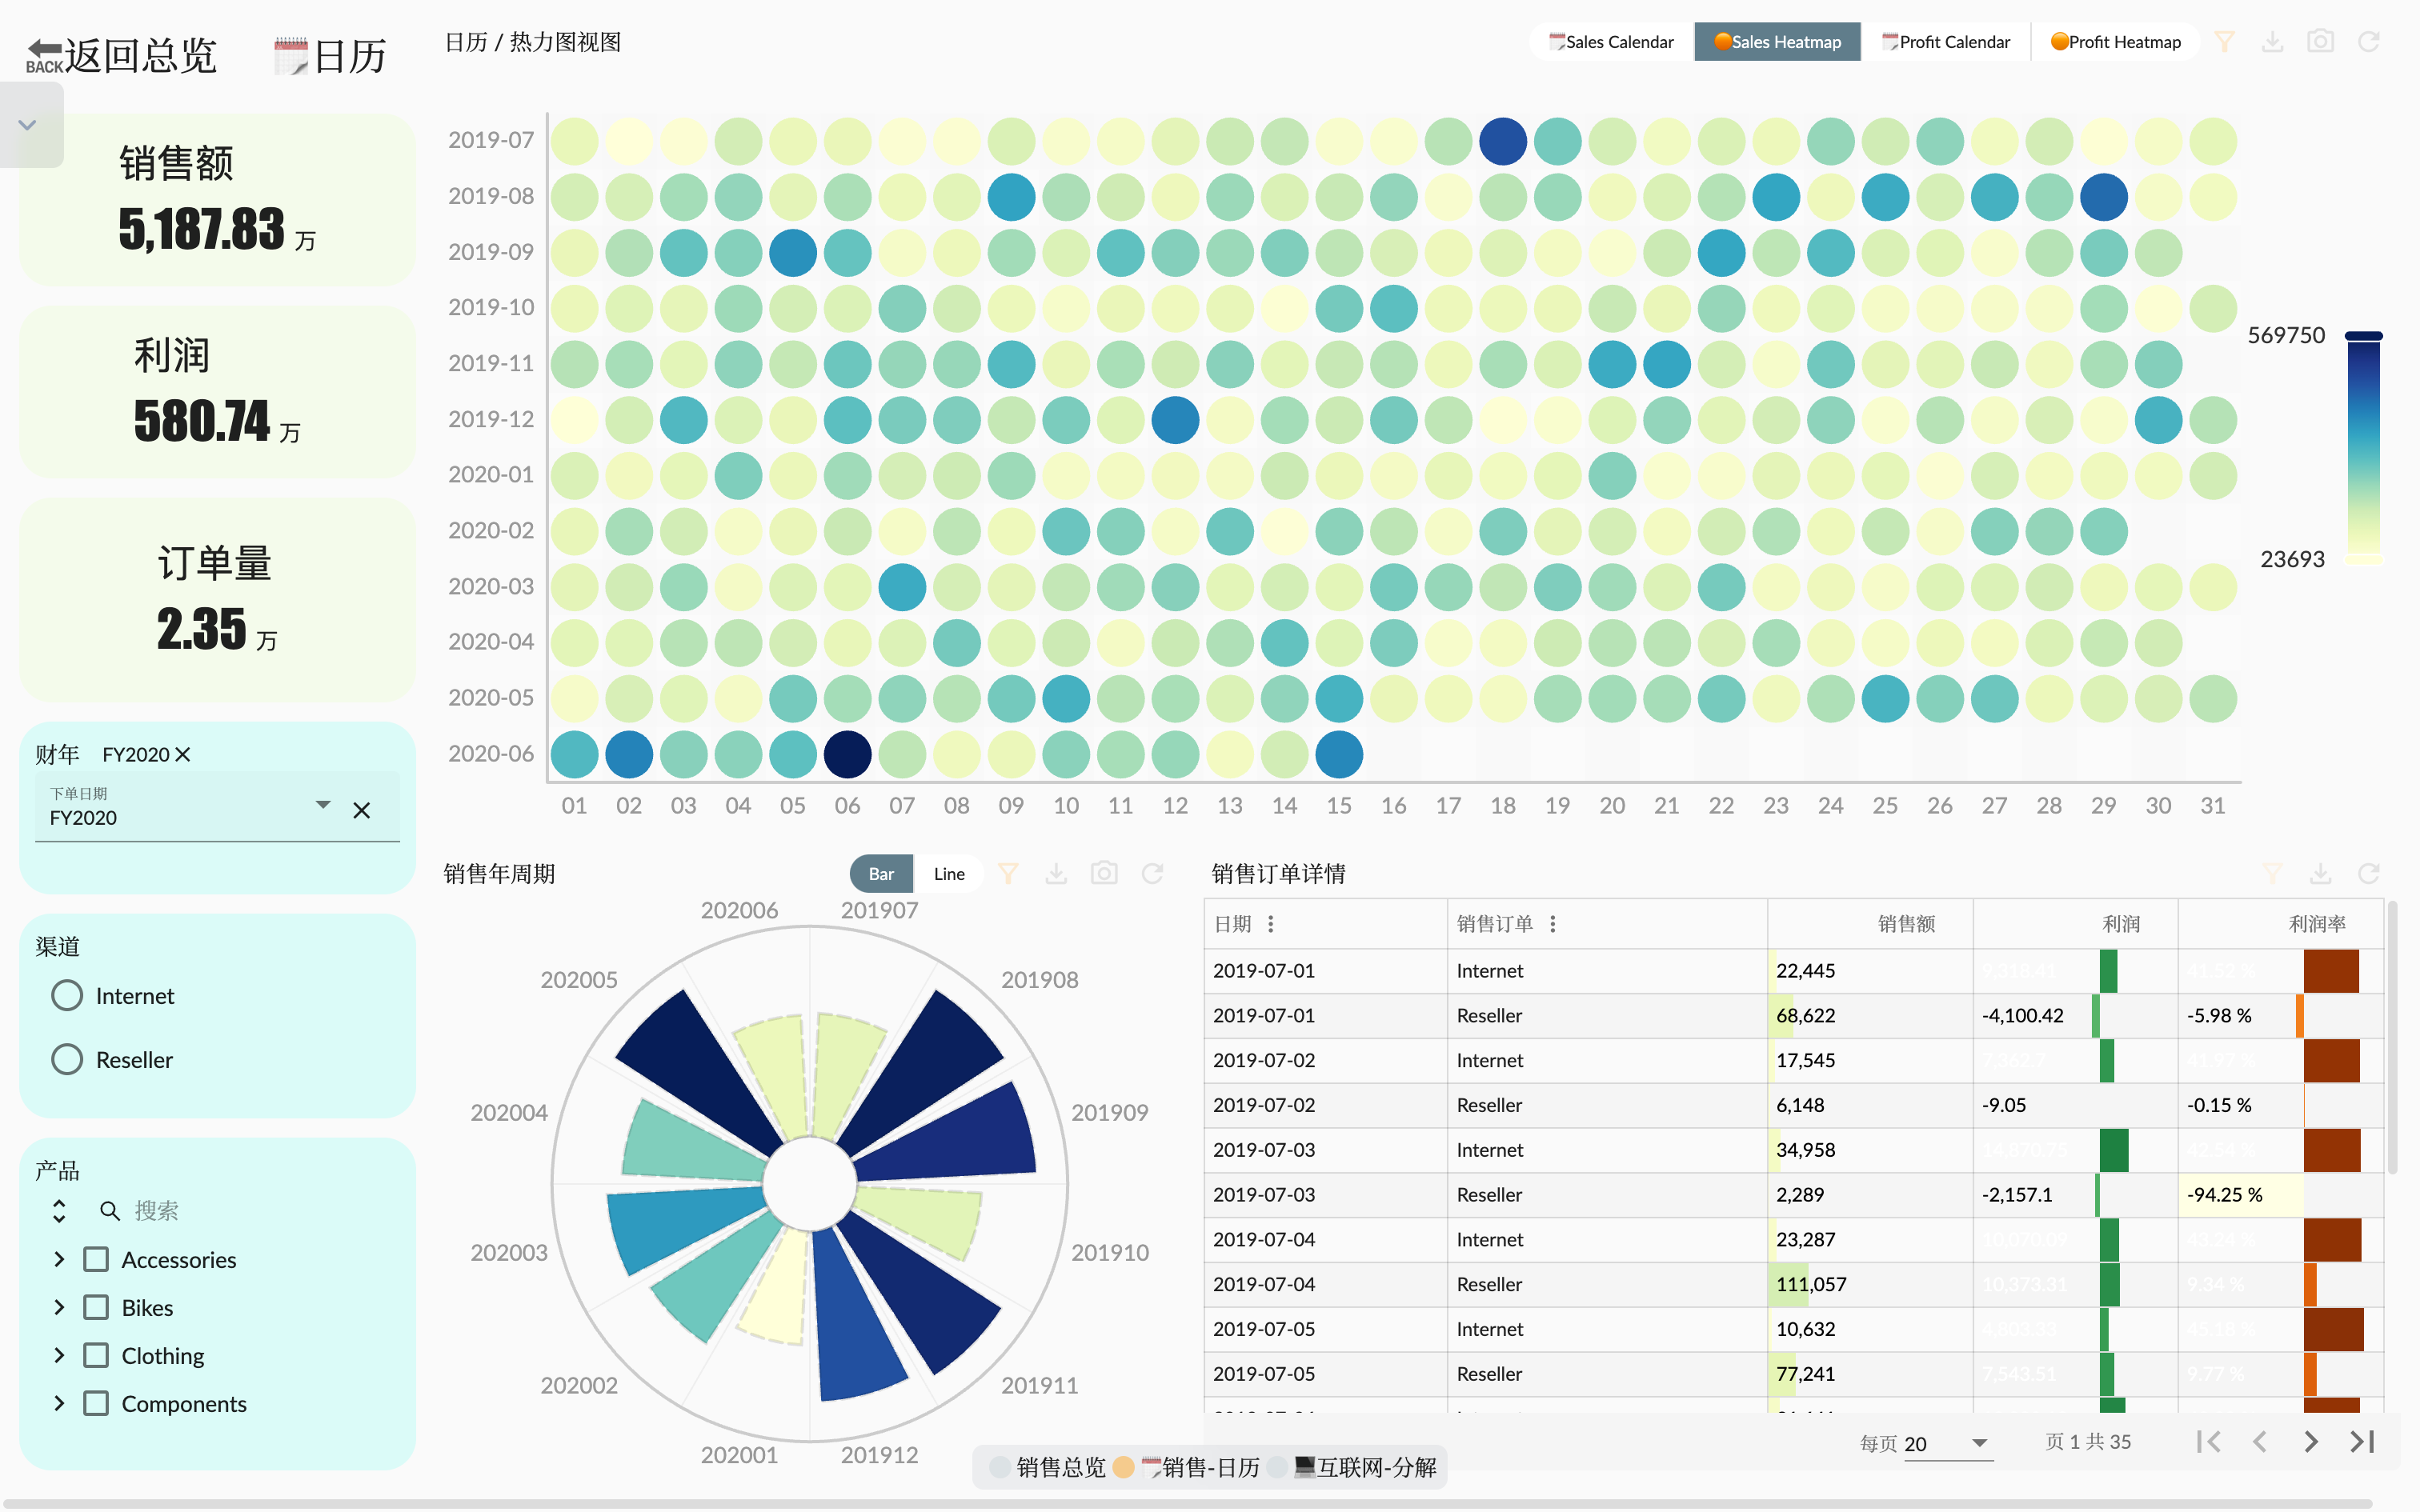
You can associate the filter conditions of different widgets through the Xpert analytics cloud's linked slicers function.

Product Profit Margin
Product Profit Margin analysis

· 5 min read
Tiven Wang

With the arrival of the third quarter of 2023, Xpert Analytics Cloud has once again stepped into a brand new version, bringing a series of exciting features and architectural upgrades. In this blog post, we will focus on the latest features of Xpert Analytics Cloud 2023 Q3 and the upgrade of the software architecture.

1. Software Architecture Upgrade

1.1 Angular 16 & Signal State Management

The Xpert analytics cloud has been successfully upgraded to the new Angular 16 version, bringing users a faster and smoother user experience. In terms of UI component state management, we have taken an important step and started to rewrite it step by step in a brand new way Signal. This will not only improve the stability and performance of the system, but also make the development process more efficient.

1.2 UI Design with Tailwind CSS

In terms of UI design, the Xpert analytics cloud 2023 Q3 version ushered in a revolutionary change. We have fully adopted Tailwind CSS to redesign the style of UI components, presenting users with a more modern and beautiful interface, and also improving the ease of operation.

New UI
New UI

· 5 min read
Tiven Wang

This article will introduce how to deploy Xpert Analytics Cloud privately and integrate it with the StarRocks data source to provide powerful multidimensional data indicator analysis capabilities for enterprises and data analysis teams. In this article, we will use tools such as Docker Compose to build and run this private deployment program.

Introduction

Xpert Analytics Cloud is an advanced data analysis platform that helps users get data from a variety of data sources and perform efficient data exploration and visual analysis. StarRocks is a fast, scalable distributed OLAP database that is particularly suitable for multidimensional data analysis. Integrating these two tools together can enhance data analysis capabilities and improve data insights.

· 6 min read
Tiven Wang

An indicator management system is a tool for collecting, analyzing and monitoring business data of enterprises. Enterprises need an indicator management system because it can help enterprises understand their business conditions, evaluate their performance and formulate effective strategic plans.

Through the OLAP engine based on the core, the Xpert Analytics Cloud establishes a unified semantic model of enterprise data, without cumbersome data transformation and ETL, and through the unified caliber indicator definition function, the enterprise operating data is uniformly managed and certified. Finally, through the indicator application provided by the Xpert Analytics Cloud, the indicator is used to analyze and evaluate the business and financial data of the company.

Indicator Application

· 12 min read
Tiven Wang

Xpert Cloud Story Dashboard is a powerful large screen display tool designed to help users visualize data and information. It offers a variety of impressive features, including individually setting widget styles and unifying setting global widget styles, allowing users to design unique widget styles according to their needs. In addition, users can customize CSS with advanced style features to achieve more refined and personalized large screen style effects. The slide widget function makes the large screen dynamic and interactive, while the custom data refresh event and automatic page turning function ensure timely data update and automatic page switching. Not only that, the dashboard also provides flexible large screen page size settings, which can be fully adapted to full screen or fixed screen size to meet a variety of display needs. Xpert Cloud Story Dashboard allows users to easily create beautiful, interactive and personalized large screen displays, bringing visual shock and pleasure to the audience.

The big screen shot
The big screen shot

· 8 min read
Tiven Wang

Xpert Analytics Cloud is a data visualization analysis platform. It provides a powerful story dashboard function, which includes the ability to customize graphic logic. This capability allows users to use common open source graphics libraries to display and manipulate custom graphics.

ECharts is an open source JavaScript chart library that provides rich visual chart types and interactive features, including line charts, bar charts, pie charts, radar charts, and more. Meta-analysis cloud integrates ECharts and provides the ability to customize graphic widget logic in the story dashboard feature so that users can create and customize graphics in a more flexible way.

With the ability to customize graphic logic, users can customize and interact with graphs by writing JavaScript code according to their own needs and data characteristics. Users can define the appearance style of the chart, data processing logic, interaction behavior and so on.

Sales Calendar Dashboard