
Xpert Cloud Story Dashboard is a powerful large screen display tool designed to help users visualize data and information. It offers a variety of impressive features, including individually setting widget styles and unifying setting global widget styles, allowing users to design unique widget styles according to their needs. In addition, users can customize CSS with advanced style features to achieve more refined and personalized large screen style effects. The slide widget function makes the large screen dynamic and interactive, while the custom data refresh event and automatic page turning function ensure timely data update and automatic page switching. Not only that, the dashboard also provides flexible large screen page size settings, which can be fully adapted to full screen or fixed screen size to meet a variety of display needs. Xpert Cloud Story Dashboard allows users to easily create beautiful, interactive and personalized large screen displays, bringing visual shock and pleasure to the audience.
Story Design
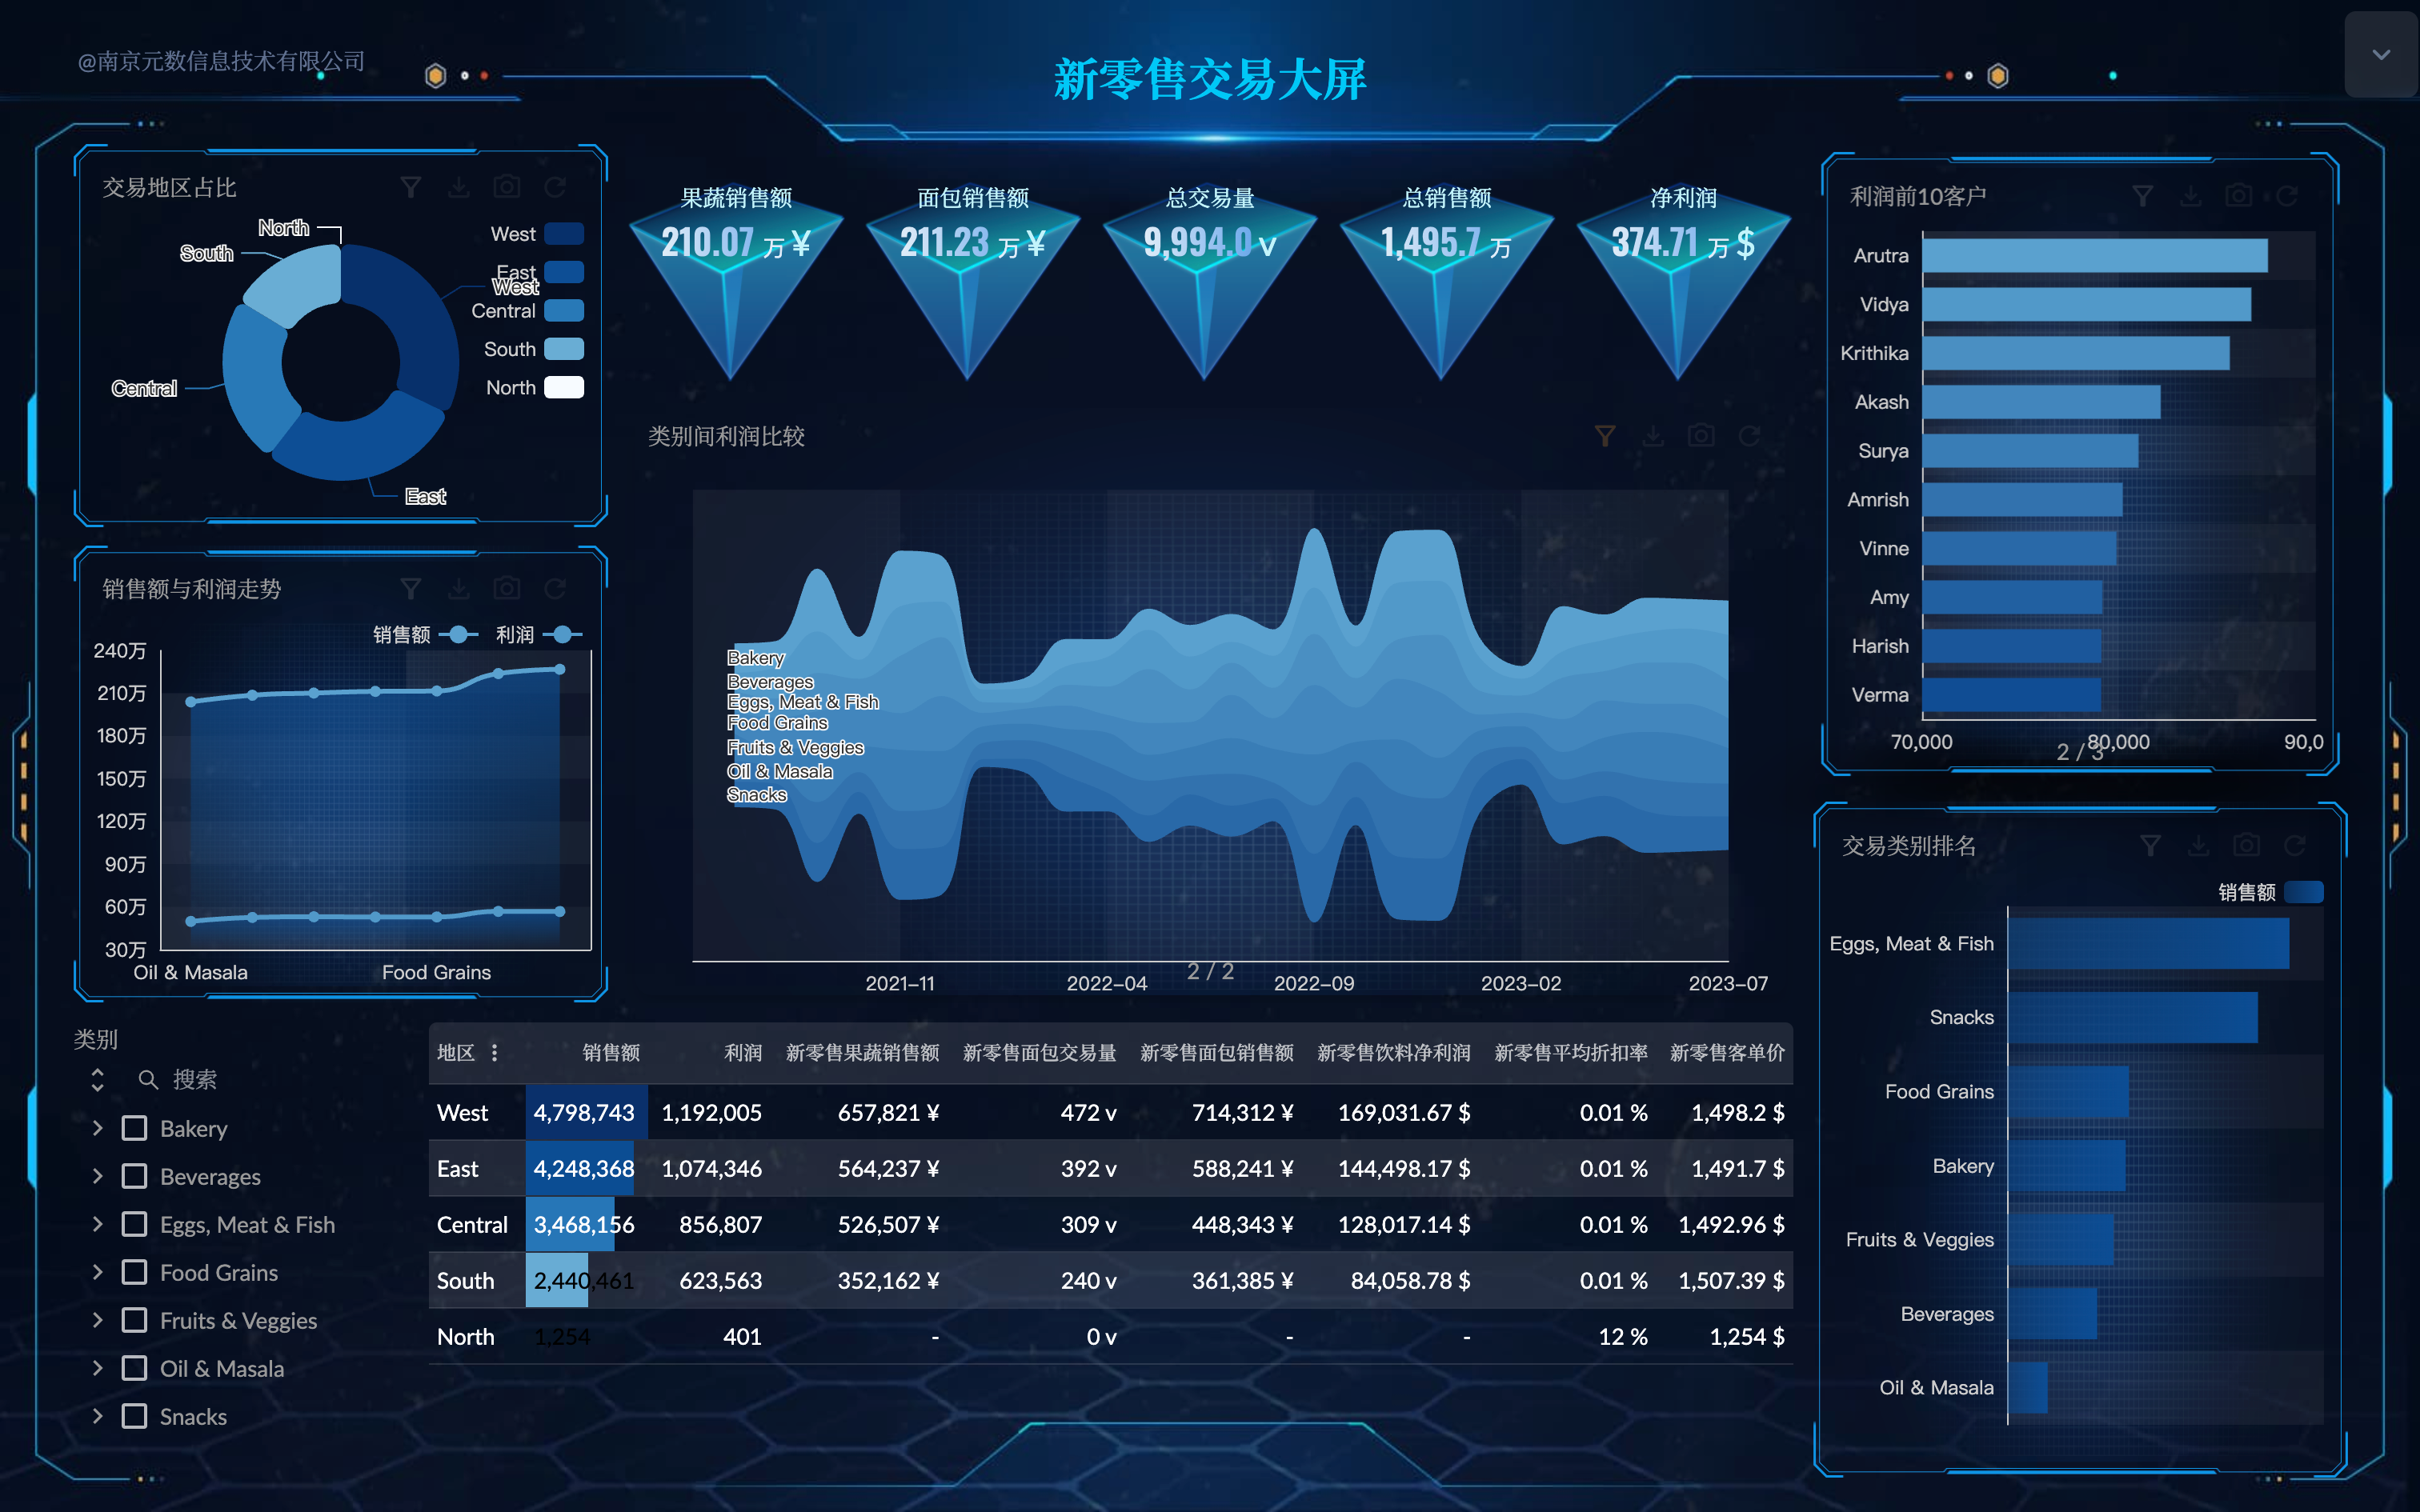
Next, we create an AdventureWorks Sales semantic model we created earlier to design a sales indicator big screen story dashboard. First determine the required indicators, such as sales, sales growth rate, and sales channel distribution. Understand the specific business needs that users want to understand, such as filtering by region, time range, or product category.
Based on the requirements and key indicators, design the layout and widgets of the large screen page. Use widgets such as charts, digital indicators, and dashboards to present data. Consider using the map widget to display the sales area distribution and the trend chart to show the sales growth rate. Ensure that the layout is clear and concise, making key indicators easy to understand.
In addition to displaying the current sales indicators, consider adding trend charts and comparison data to the big screen page. Use the historical data in the AdventureWorks Sales model to draw trend charts to show sales growth trends, which helps users better understand sales performance and make corresponding decisions.
Also ensure that the data on the big screen page can be refreshed in real time.
Bigview Size
The Xpert Analytics Cloud Storyboard provides a variety of options to meet the needs of different large-screen displays. Users can choose the size of the large screen page according to the actual situation to ensure the best display effect. The dashboard supports full-screen adaptation, so that the content can make full use of the entire screen space, and also supports fixed screen size to meet the display requirements in specific scenarios.
- Adapt to screen size
- Fixed dashboard size
Adapt Screen Size
In this mode, the story dashboard will adaptively adjust according to the size of the screen to ensure that the dashboard content is scaled in proportion to the length and width, but the pixel size remains unchanged. This means that no matter what size screen you view on, the layout and widgets of the story dashboard will automatically adjust to keep the same relative position and proportion. Such adaptive design allows the story dashboard to achieve the best visual effect on displays of different sizes, and the content may be deformed.
To create a story dashboard that adapts to screen size, refer to New canvas page and select the web page layout type Fit the screen.
Fixed Dashboard Size
In this mode, the size of the story dashboard is fixed, regardless of the size of the screen on which it is viewed, the dashboard will be pixel scaled according to the screen size. This means that on screens of different sizes, the dashboard will be scaled according to the pixel density of the device to ensure the clarity and detail of images and text. Since the size of the dashboard is fixed, it may result in content that is smaller on smaller screens or larger on larger screens.
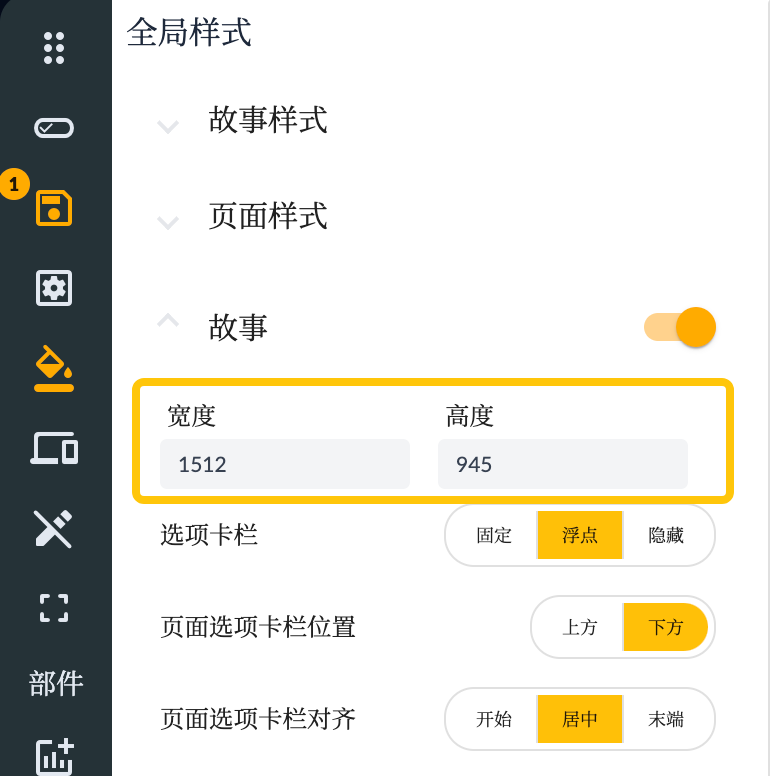
Create a fixed size story dashboard by width and height of the story in global style:
Background
Design a background image that matches the theme and content of the dashboard and is visually appealing. The color of the background image should be consistent with the color palette used in the story dashboard to ensure the overall style. Consider using gradients, textures, or patterns to increase visual effects and hierarchy. Make sure the background image is simple and clear, avoiding too many details and distracting elements. The background should be a background that supports content display, not the protagonist that distracts the audience.
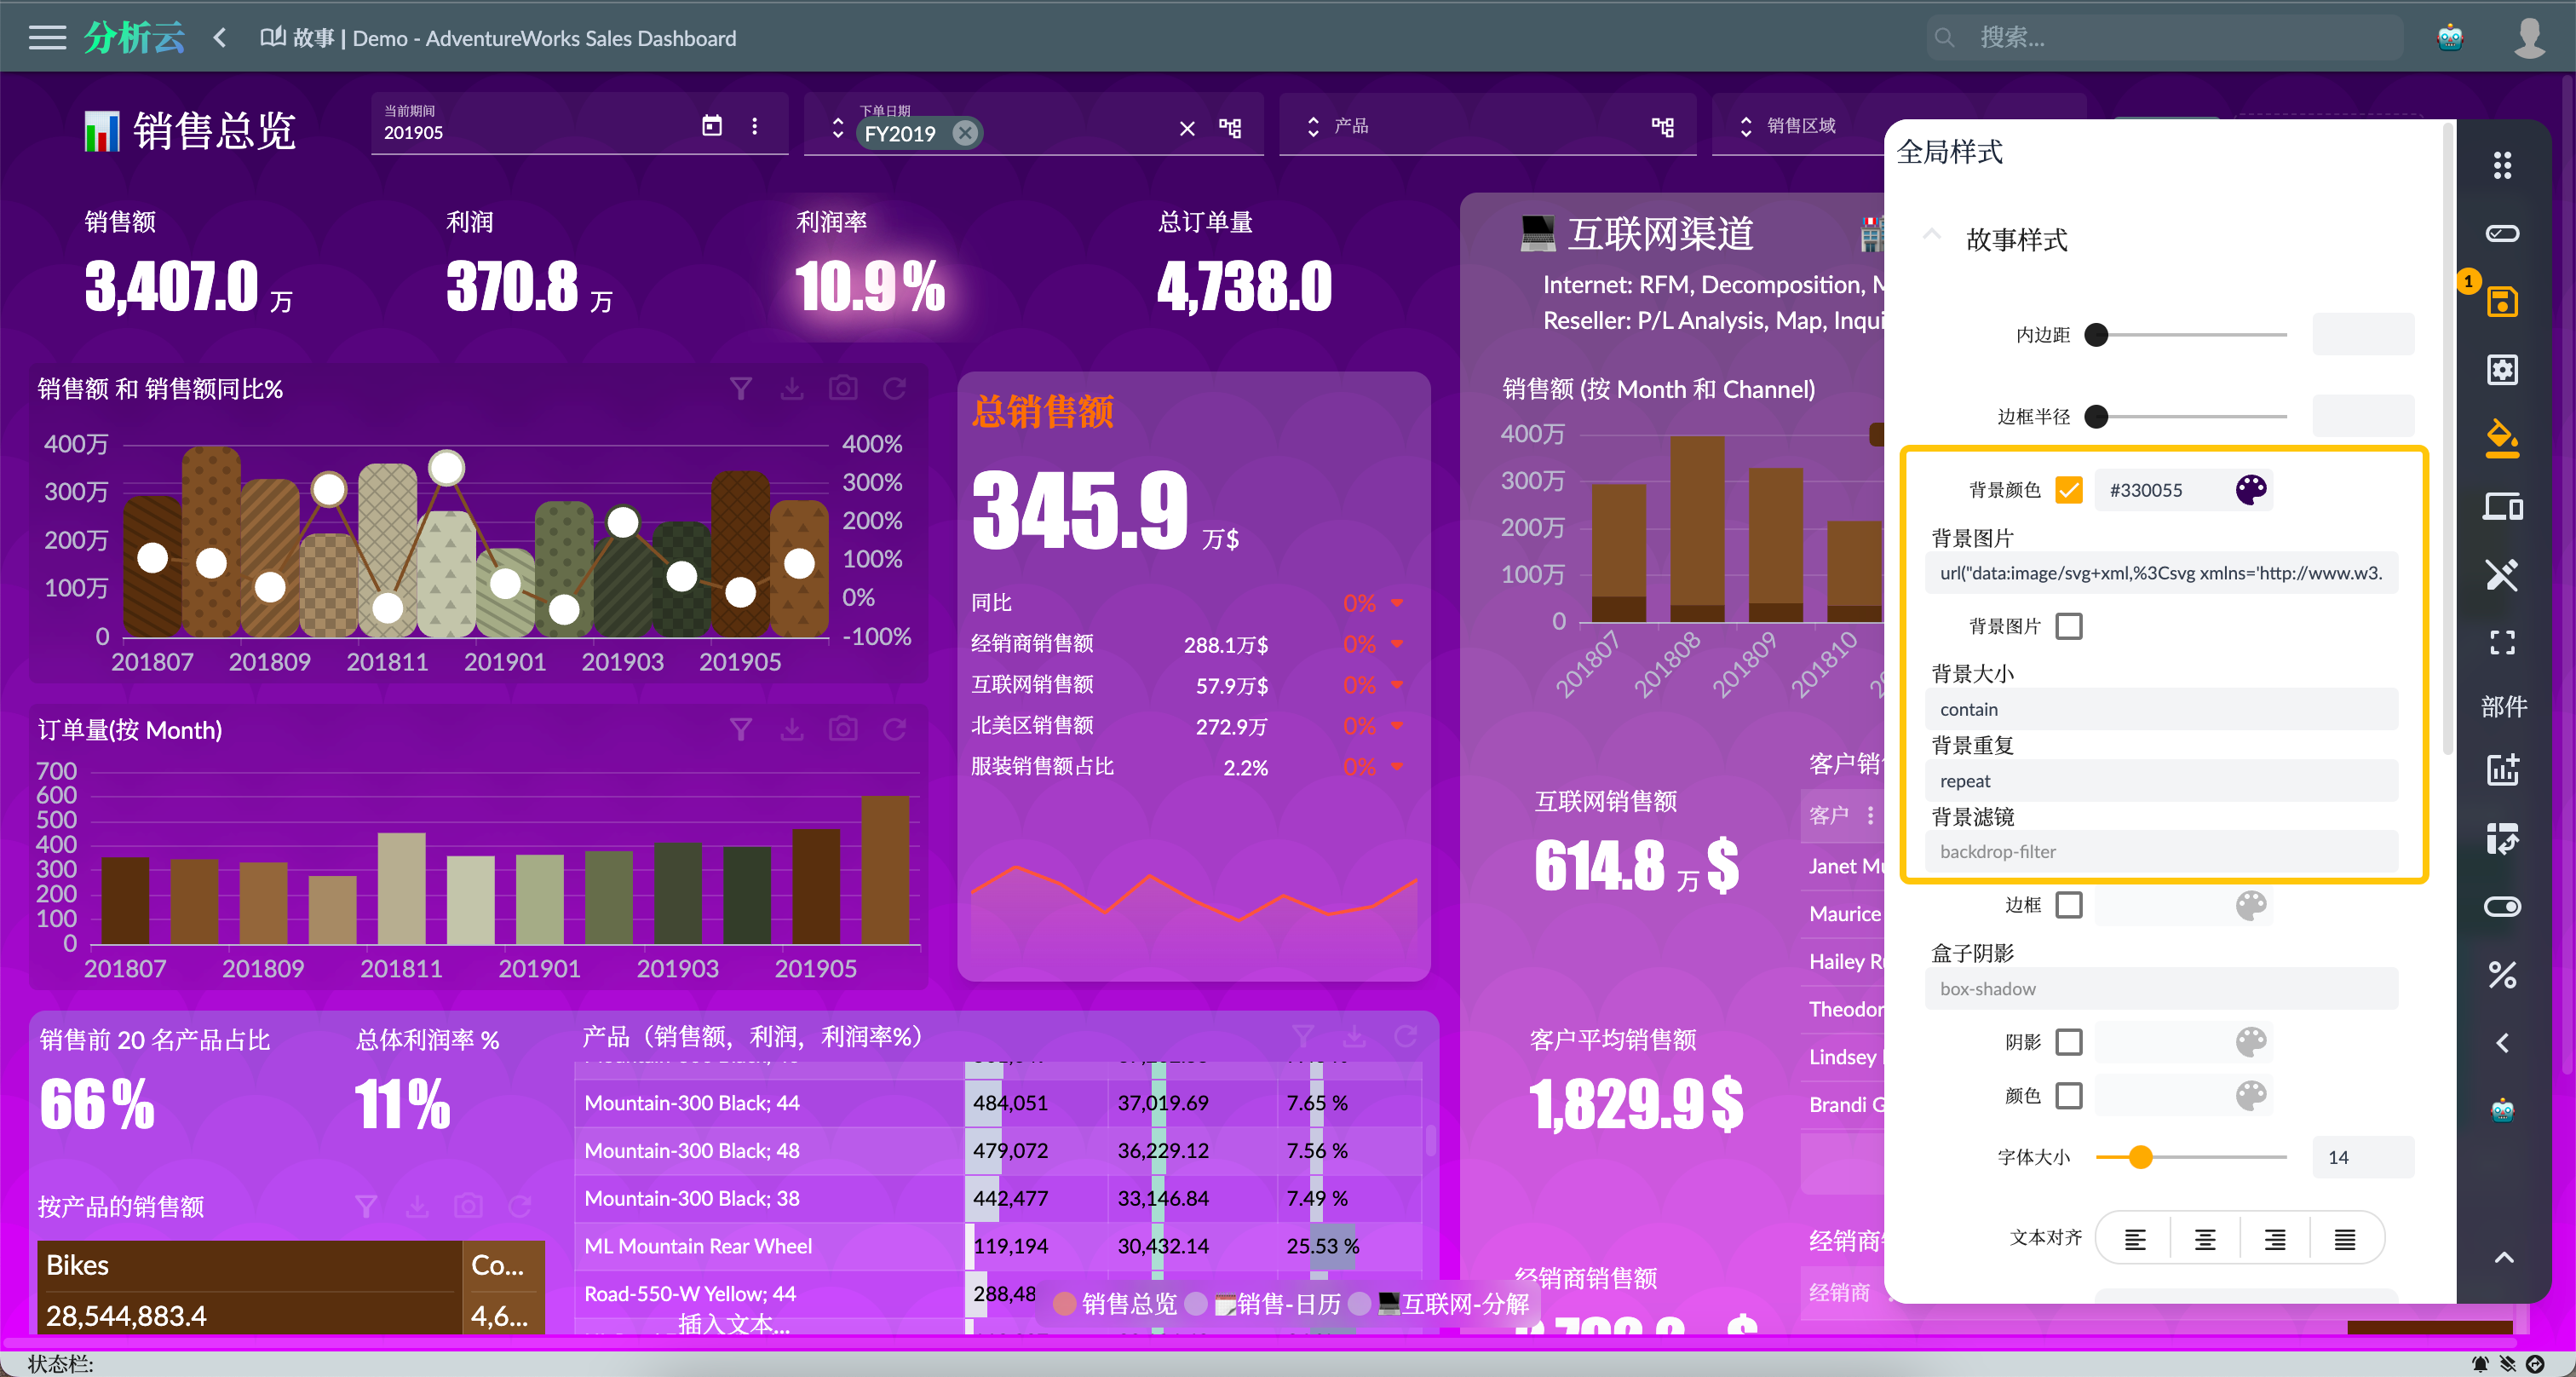
- Use solid color or gradient or set as background image in svg format
- Upload the designed background image
Svg Background and Mode
- As shown in the following css background configuration, you can use the svg format background image
background-color: #330055;
background-image: url("data:image/svg+xml,%3Csvg xmlns='http://www.w3.org/2000/svg' viewBox='0 0 100 1000'%3E%3Cg %3E%3Ccircle fill='%23330055' cx='50' cy='0' r='50'/%3E%3Cg fill='%233a015d' %3E%3Ccircle cx='0' cy='50' r='50'/%3E%3Ccircle cx='100' cy='50' r='50'/%3E%3C/g%3E%3Ccircle fill='%23410165' cx='50' cy='100' r='50'/%3E%3Cg fill='%2348026e' %3E%3Ccircle cx='0' cy='150' r='50'/%3E%3Ccircle cx='100' cy='150' r='50'/%3E%3C/g%3E%3Ccircle fill='%23500376' cx='50' cy='200' r='50'/%3E%3Cg fill='%2357047e' %3E%3Ccircle cx='0' cy='250' r='50'/%3E%3Ccircle cx='100' cy='250' r='50'/%3E%3C/g%3E%3Ccircle fill='%235f0587' cx='50' cy='300' r='50'/%3E%3Cg fill='%2367068f' %3E%3Ccircle cx='0' cy='350' r='50'/%3E%3Ccircle cx='100' cy='350' r='50'/%3E%3C/g%3E%3Ccircle fill='%236f0798' cx='50' cy='400' r='50'/%3E%3Cg fill='%237707a0' %3E%3Ccircle cx='0' cy='450' r='50'/%3E%3Ccircle cx='100' cy='450' r='50'/%3E%3C/g%3E%3Ccircle fill='%238008a9' cx='50' cy='500' r='50'/%3E%3Cg fill='%238909b1' %3E%3Ccircle cx='0' cy='550' r='50'/%3E%3Ccircle cx='100' cy='550' r='50'/%3E%3C/g%3E%3Ccircle fill='%239109ba' cx='50' cy='600' r='50'/%3E%3Cg fill='%239a09c3' %3E%3Ccircle cx='0' cy='650' r='50'/%3E%3Ccircle cx='100' cy='650' r='50'/%3E%3C/g%3E%3Ccircle fill='%23a309cb' cx='50' cy='700' r='50'/%3E%3Cg fill='%23ad09d4' %3E%3Ccircle cx='0' cy='750' r='50'/%3E%3Ccircle cx='100' cy='750' r='50'/%3E%3C/g%3E%3Ccircle fill='%23b608dc' cx='50' cy='800' r='50'/%3E%3Cg fill='%23c007e5' %3E%3Ccircle cx='0' cy='850' r='50'/%3E%3Ccircle cx='100' cy='850' r='50'/%3E%3C/g%3E%3Ccircle fill='%23c905ee' cx='50' cy='900' r='50'/%3E%3Cg fill='%23d303f6' %3E%3Ccircle cx='0' cy='950' r='50'/%3E%3Ccircle cx='100' cy='950' r='50'/%3E%3C/g%3E%3Ccircle fill='%23D0F' cx='50' cy='1000' r='50'/%3E%3C/g%3E%3C/svg%3E");
background-attachment: local;
background-size: contain;
- corresponding element with background svg
- The actual dashboard effect
Background Image
Using a designed image can ensure that the background matches the theme of the story dashboard. The designed image can be customized according to the content and goals of the dashboard, so that it is visually coordinated with the data and information, providing a more consistent visual experience. Including brand elements or company logos in the picture can increase brand exposure and recognition.
There are several ways to configure the background image:
- Configure the link directly to set the
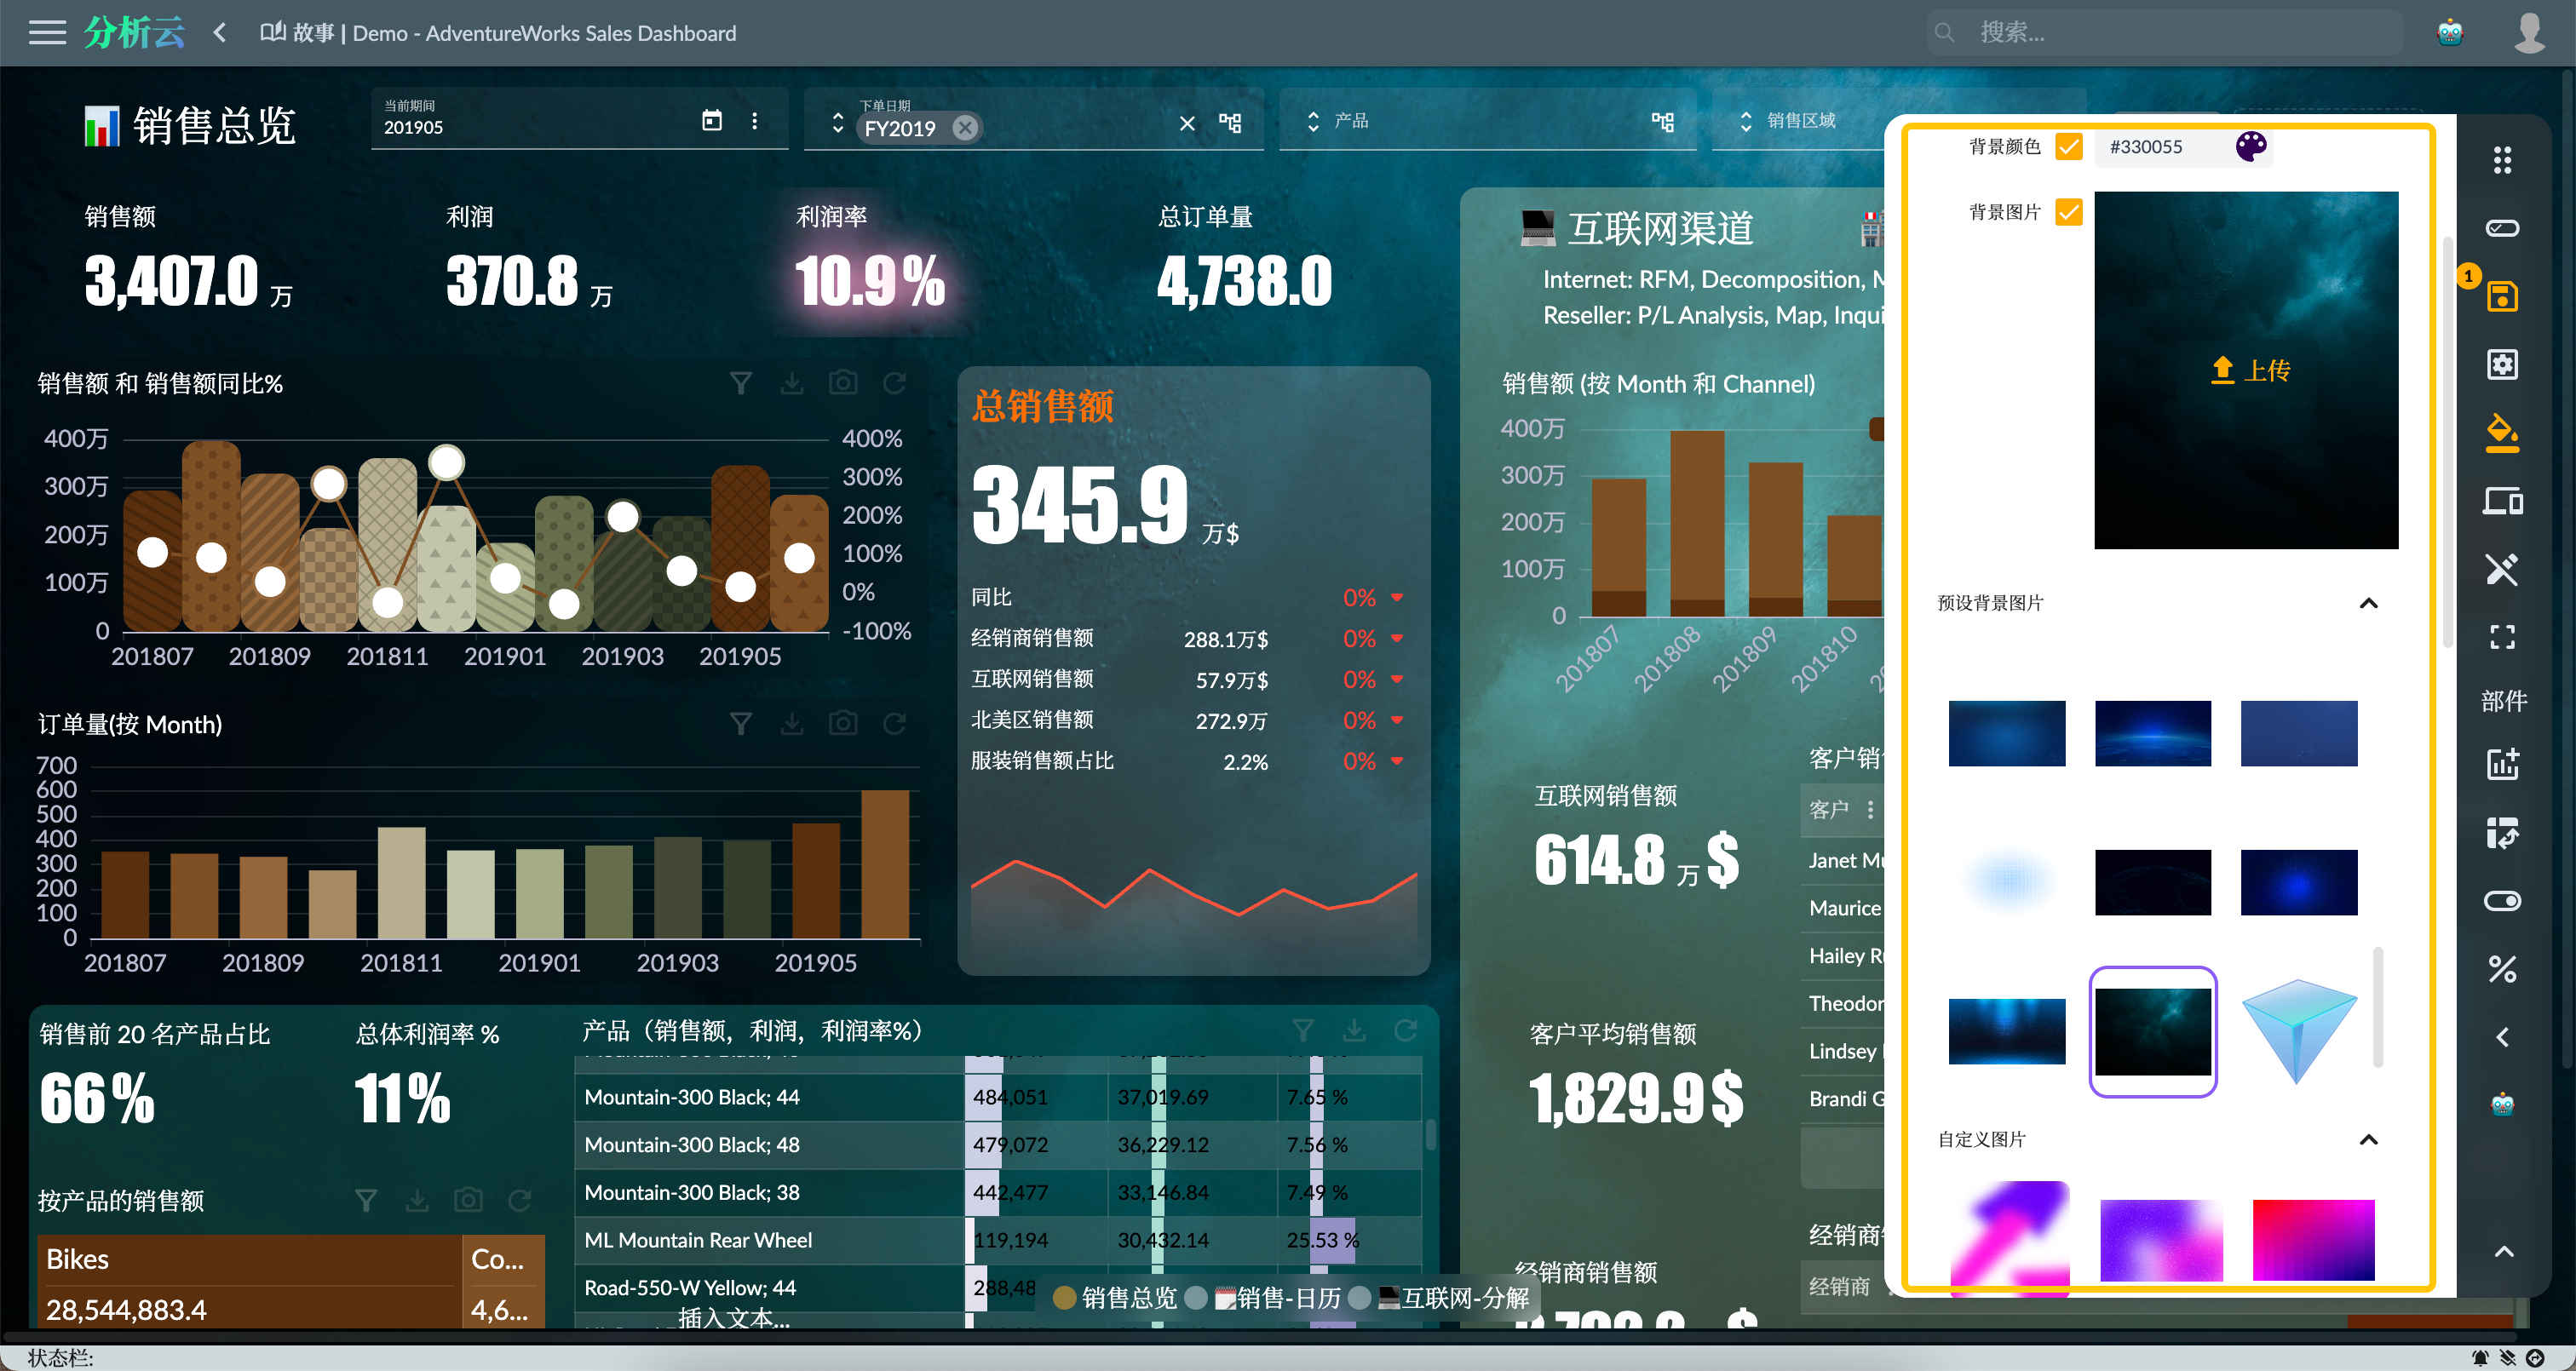
background-imageproperty - Switch to the background image configuration page and select the built-in background image of the system.
- You can also upload your own pictures, click the upload button to upload the picture, and then select the corresponding picture.
Other Widget Background
In addition to the background of the story dashboard, users can also set the background of other widgets. For example, set the background image of the story point page and the widget separately, the setting method is the same as the story background image.
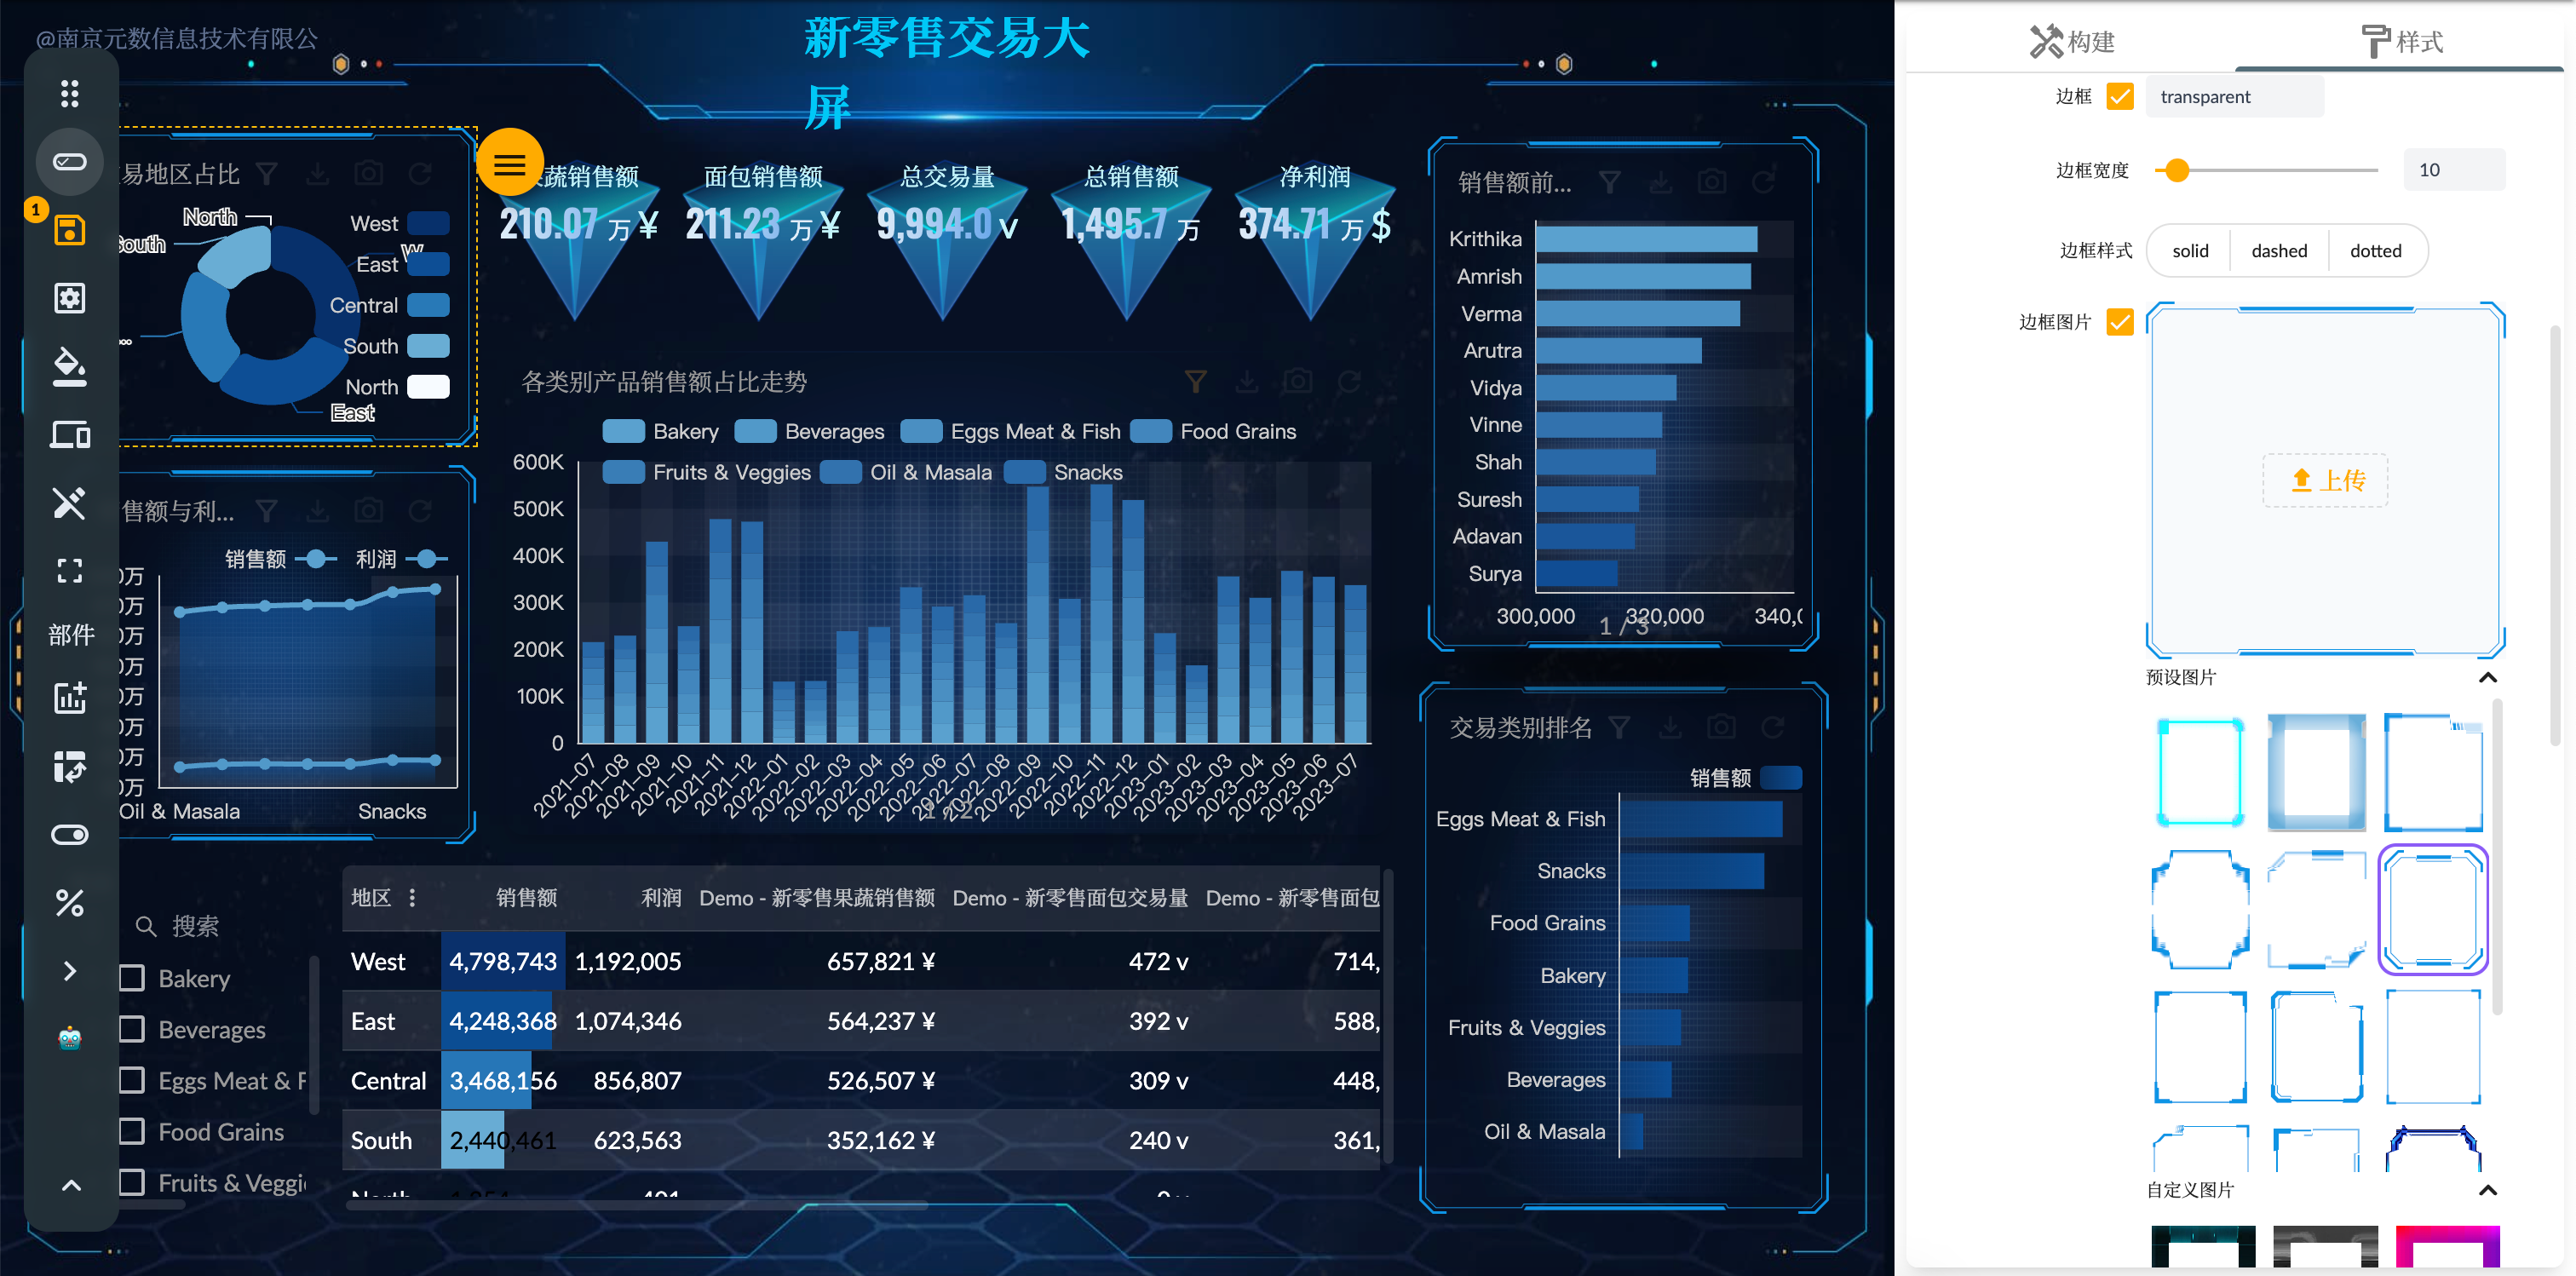
Widget Border
Setting the widget border and border image can increase the aesthetics of the large screen, improve the visual appeal, and enhance the user experience.
As shown in the figure below, the story dashboard widget border can be set through these attributes (corresponding to the css attribute):
- Border color:
border-color - Border width:
border-width - Border style:
border-style - Border image:
border-image- Preset border image
- Custom border image (user upload)
- Border slice:
border-image-slice - Box shadow:
box-shadow - Shadow:
box-shadow
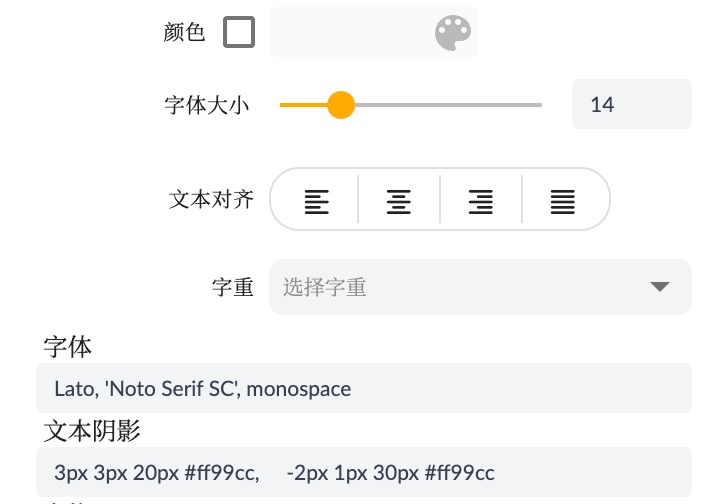
Text Style
The text style of the widget has an important impact on the readability, visual appeal and user experience of the large screen. By using bold, italics or different font sizes, key information can be distinguished from other content, attracting the audience's attention and making it easier to understand and remember key information. By selecting artistic fonts or special effects that match the theme, the big screen can be more visually eye-catching.
The widget text style can be set through the following attributes:
3D Effect
In terms of data visualization, 3D graphics can present data more vividly, enhance the three-dimensional sense and depth of data. Especially when showing complex relationships and trends, 3D graphics can better express the correlation between data, making it easier for the audience to understand and interpret the data.
To add a three-dimensional effect to a dashboard, you can do the following:
- Custom graphics: Three-dimensional graphics effects can be achieved through ECharts' globe and other types, and automatic rotation can be set.
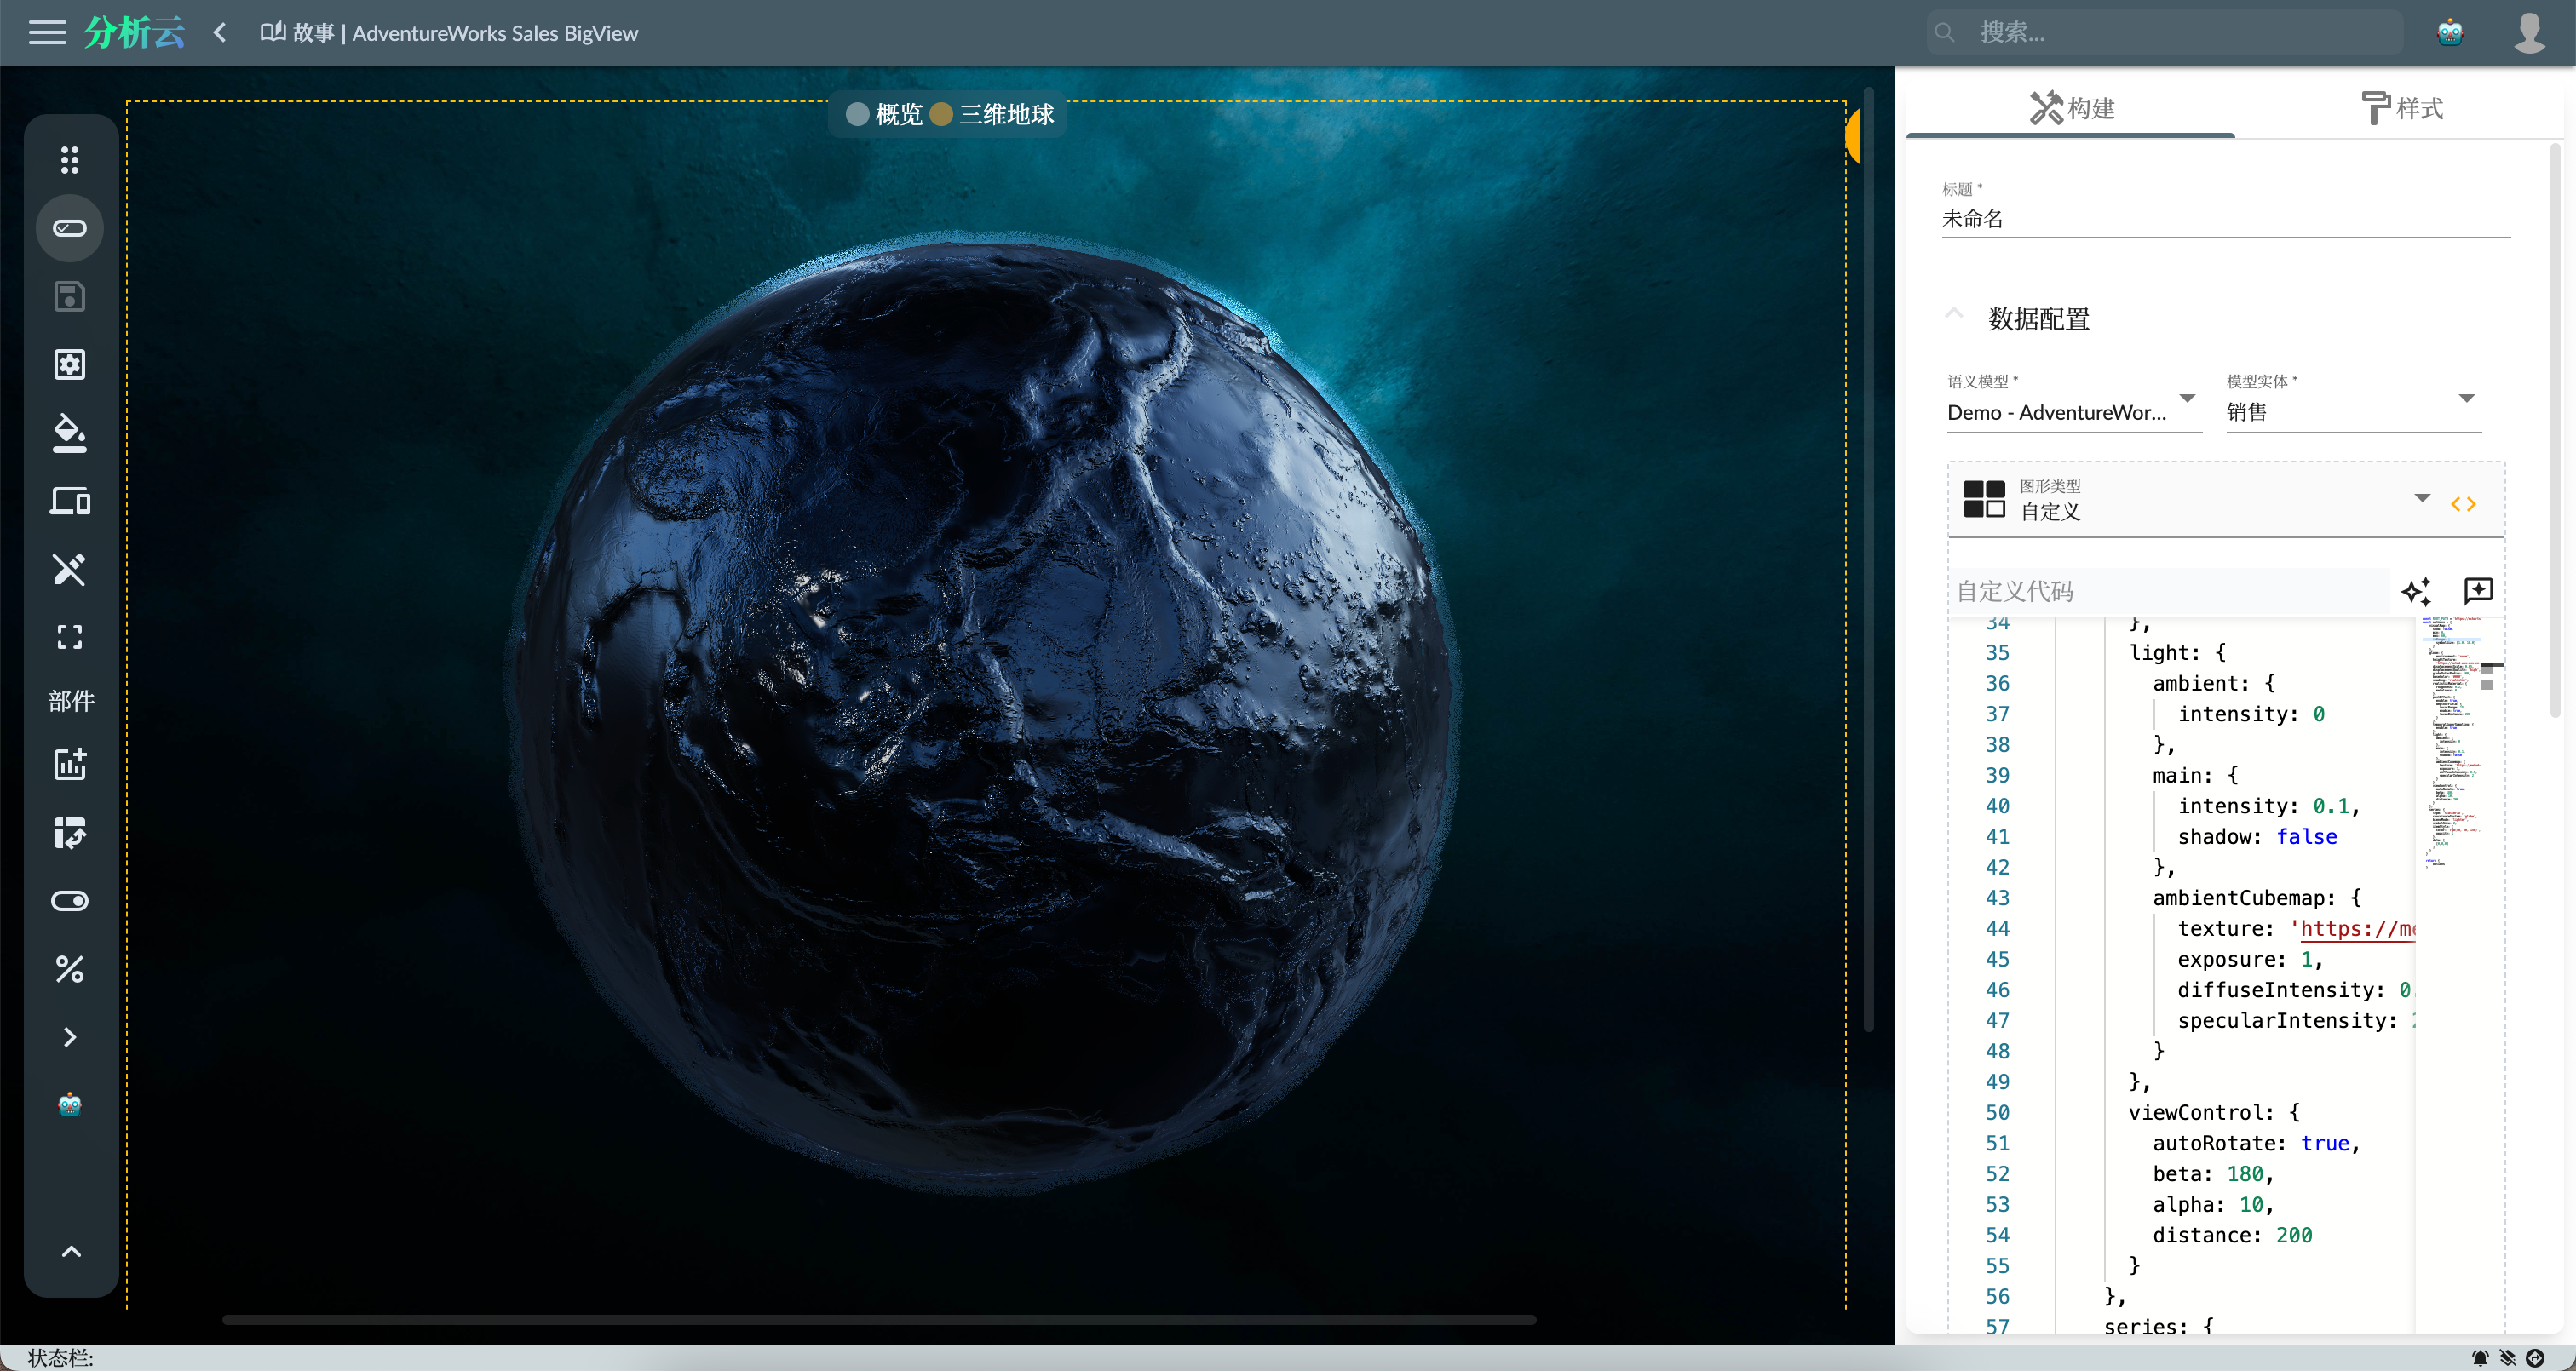
About custom chart, see Sample: AdventureWorks Sales - 5. Custom chart.
- Video Widget:If you just want to add a 3D dynamic background, you can consider using the video widget, which can add a 3D video as the background and achieve similar effects.
Color Themes
Set the color theme for Storyboard, which can make the dashboard more visually appealing, and can also enhance the visual appeal and user experience of the dashboard.
Global Color Theme
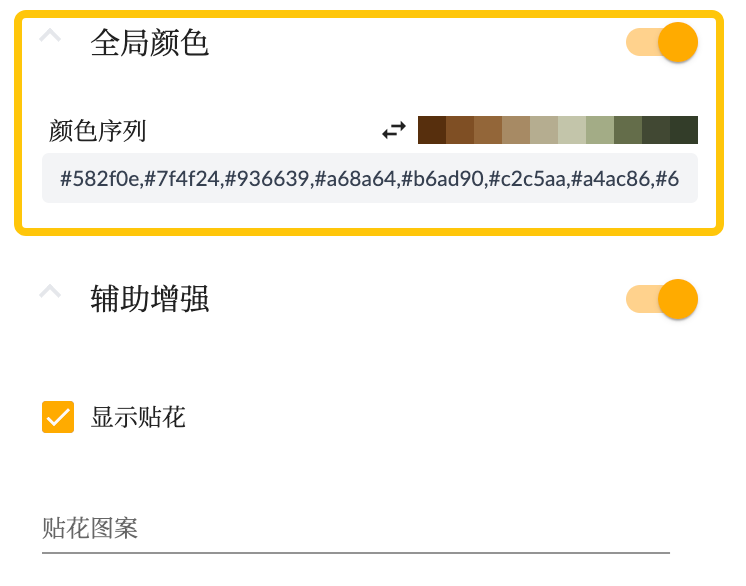
As shown in the figure below, you can set the color mode and color sequence of the story dashboard in the global settings. The theme will be applied to all widgets and graphics in the story dashboard.
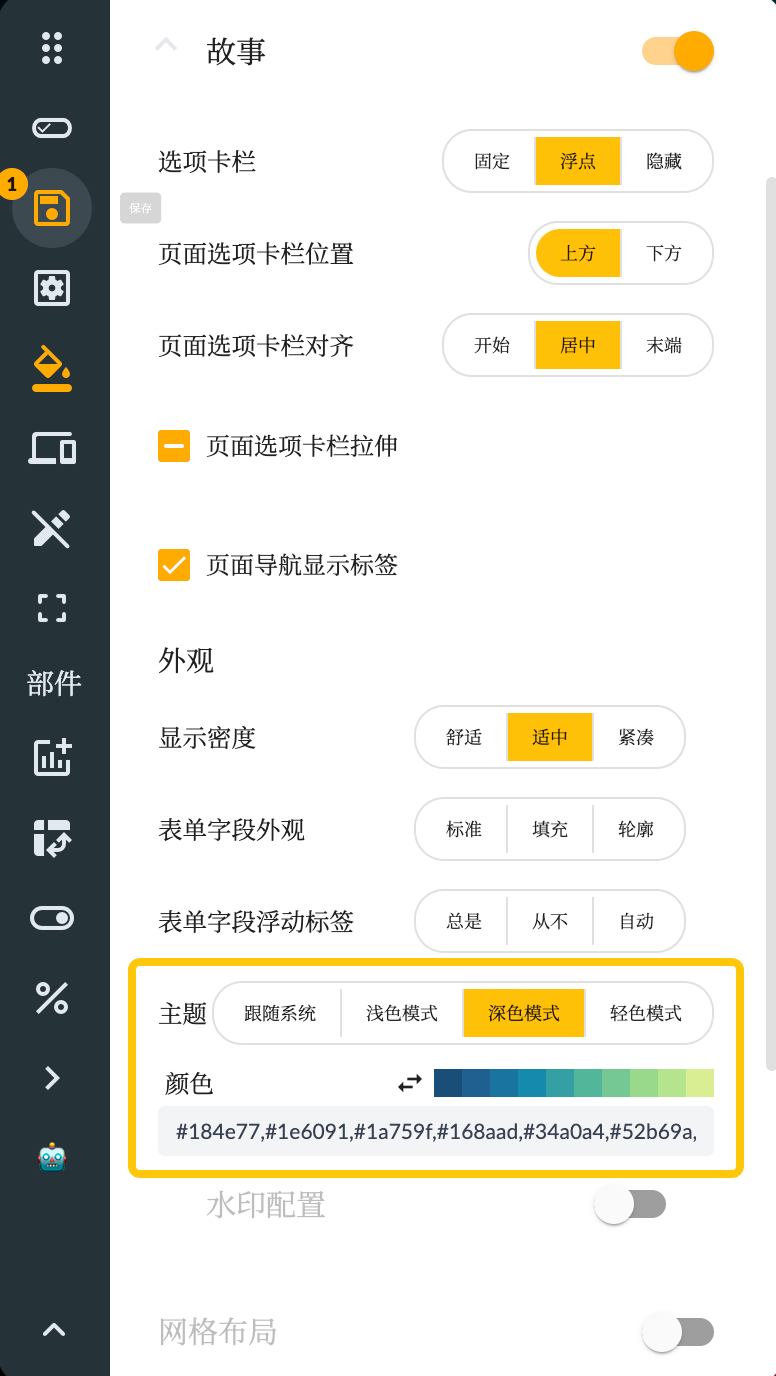
In addition to the system's built-in color sequence, the user can also design the color sequence, and then copy the color sequence to the color sequence widget input box of the story dashboard, such as:
#ea698b, #d55d92, #c05299, #ac46a1, #973aa8, #822faf, #6d23b6, #6411ad, #571089, #47126b
For example, this website can generate a color sequence:https://coolors.co/palettes/popular/gradient
ECharts Themes
According to the above story themes, users can customize the corresponding ECharts theme configuration. Users can customize the theme through the ECharts theme building tool, and then copy the theme configuration to the ECharts theme configuration of the story themes.
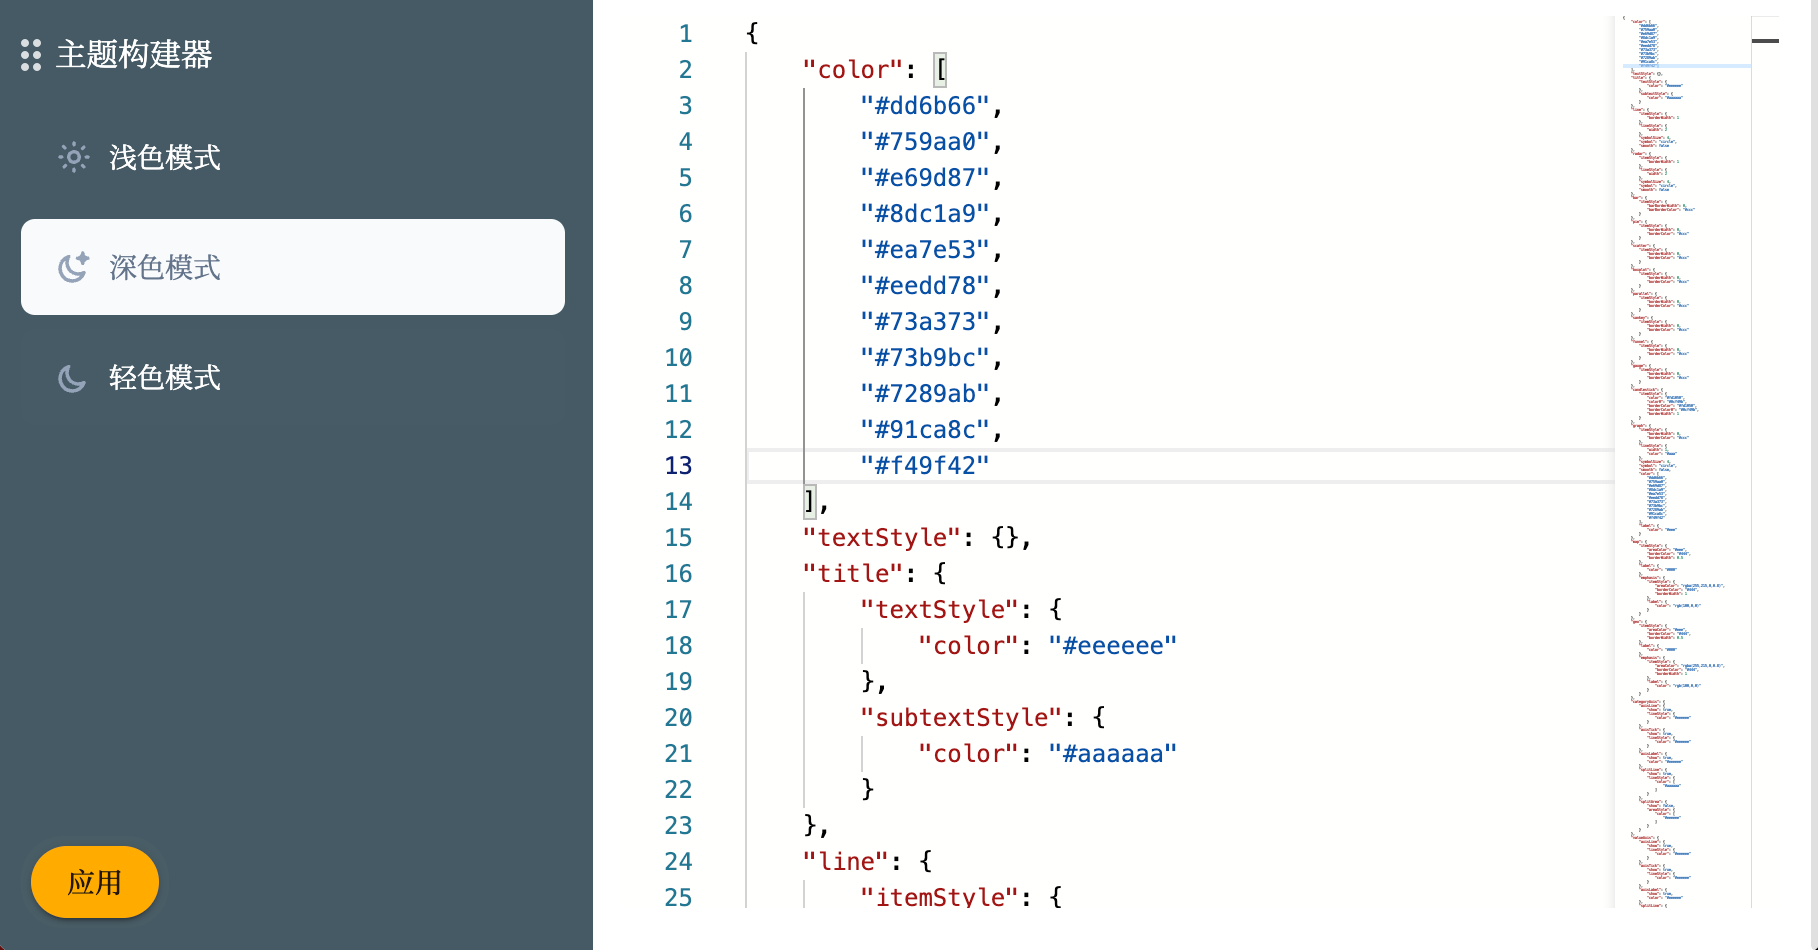
Chart Color Sequence
In addition to setting the color sequence of the story dashboard uniformly, you can also set the color sequence of a single graphic widget or graphic series. This can achieve different color sequences of different graphic widgets or graphic series, thereby achieving better visual effects.
- For the global color of chart attributes
The color sequence here will be assigned to the graphic data elements in order. If the data elements exceed the length of the color sequence, the colors in the color sequence will be used in cycles.
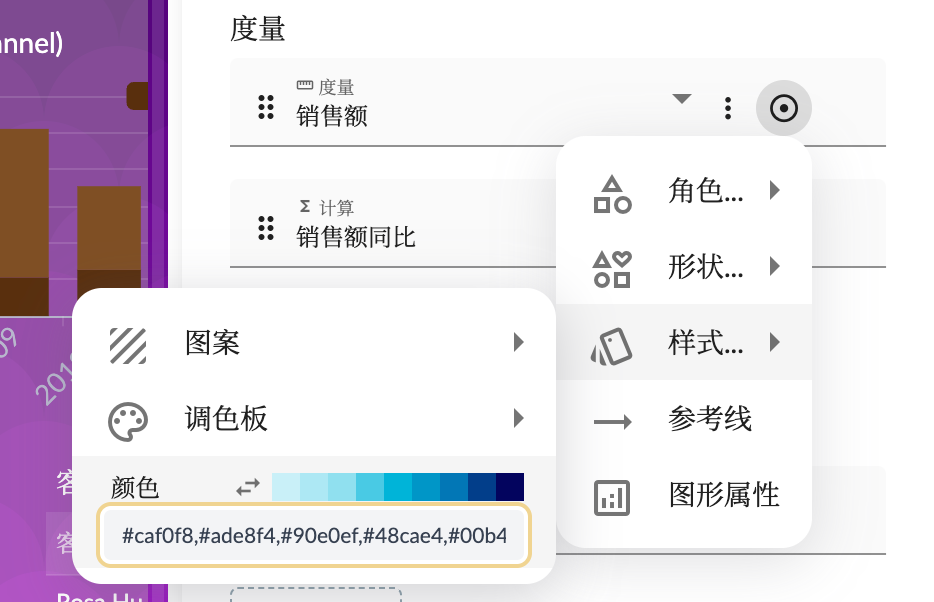
- Set color sequence and pattern for measure field
Setting a color sequence for a measur field separately can achieve the effect of determining the color change according to the range and size of the measure values, so as to achieve a better visual effect.
Advanced Styles
To meet the needs of more advanced users, story dashboard also supports custom CSS styles. Users can write custom CSS code according to their technical level and design requirements to achieve more refined and personalized large-screen style effects.
Advanced Styles settings have the following multiple application scenarios:
- Load new fonts.
- Set specific page element styles.
- Achieve more dynamic effects
Swiper Widget
In order to increase the dynamic effect and interactivity of the large screen, the dashboard provides a Swiper . Users can add sliding widgets to the large screen to display multiple pages or information blocks. These sliding widgets can be automatically cycled, so that the information is switched at a certain time interval, presenting the audience with richer content.
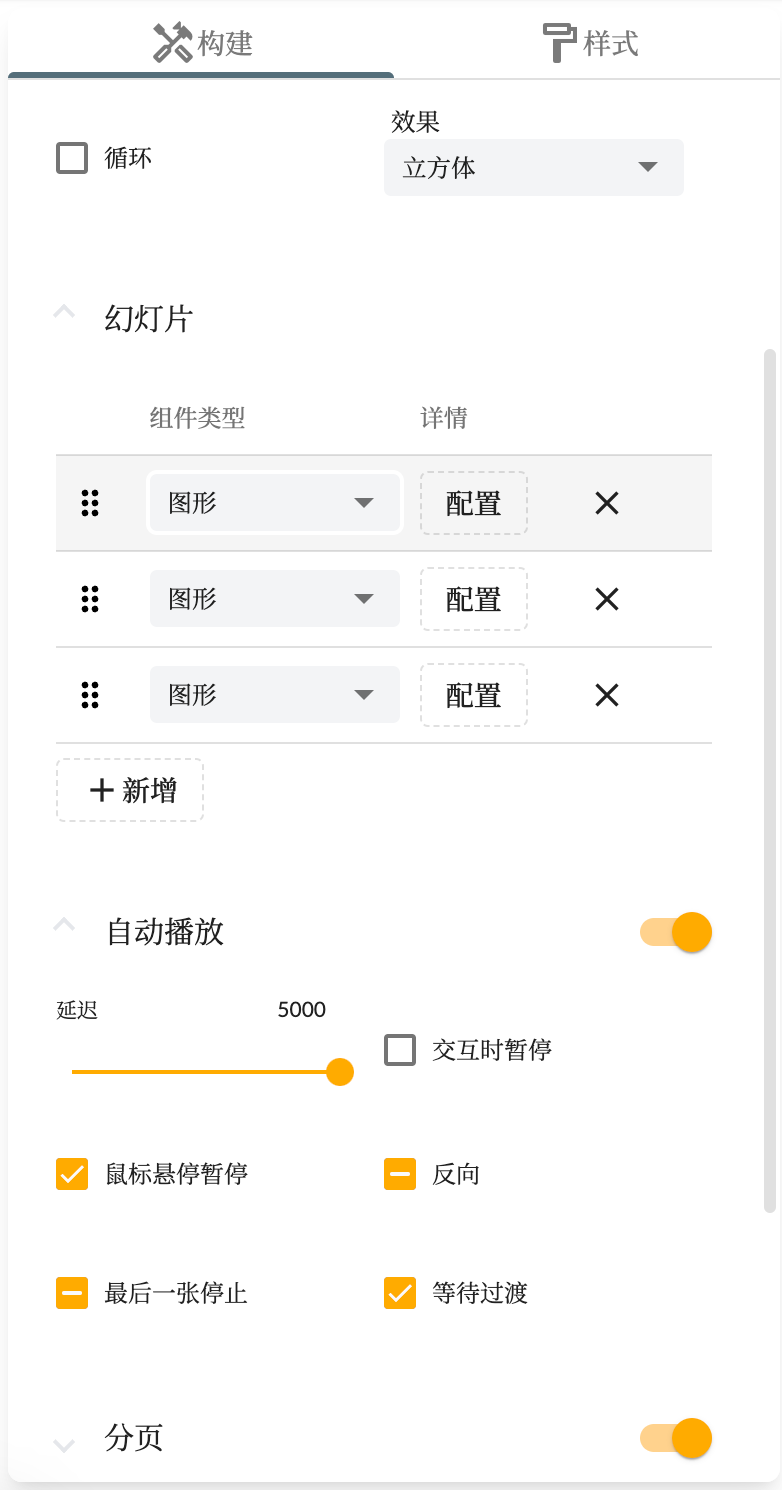
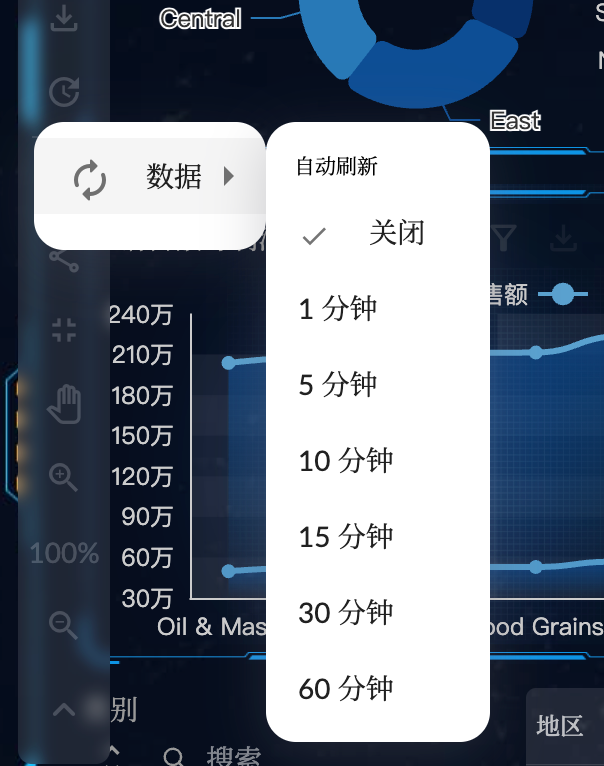
Automatic Refresh and Automatic Page Turning
In order to ensure that the data on the big screen can be updated in time, the story dashboard allows users to set custom data refresh events. Users can specify the time interval or trigger condition for data update to ensure that the data displayed on the big screen is up to date. In addition, users can also set up automatic page turning function, so that the big screen content automatically switch pages at the set time or conditions.
Summary
Through the above functions, the Xpert Analytics Cloud story dashboard provides rich functions and flexibility, enabling users to create beautiful, interactive and personalized large-screen displays. Whether it is used for data reporting, business display or information display in other fields, the dashboard can meet the needs of users and bring users a better visual experience.