An indicator management system is a tool for collecting, analyzing and monitoring business data of enterprises. Enterprises need an indicator management system because it can help enterprises understand their business conditions, evaluate their performance and formulate effective strategic plans.
Through the OLAP engine based on the core, the Xpert Analytics Cloud establishes a unified semantic model of enterprise data, without cumbersome data transformation and ETL, and through the unified caliber indicator definition function, the enterprise operating data is uniformly managed and certified. Finally, through the indicator application provided by the Xpert Analytics Cloud, the indicator is used to analyze and evaluate the business and financial data of the company.
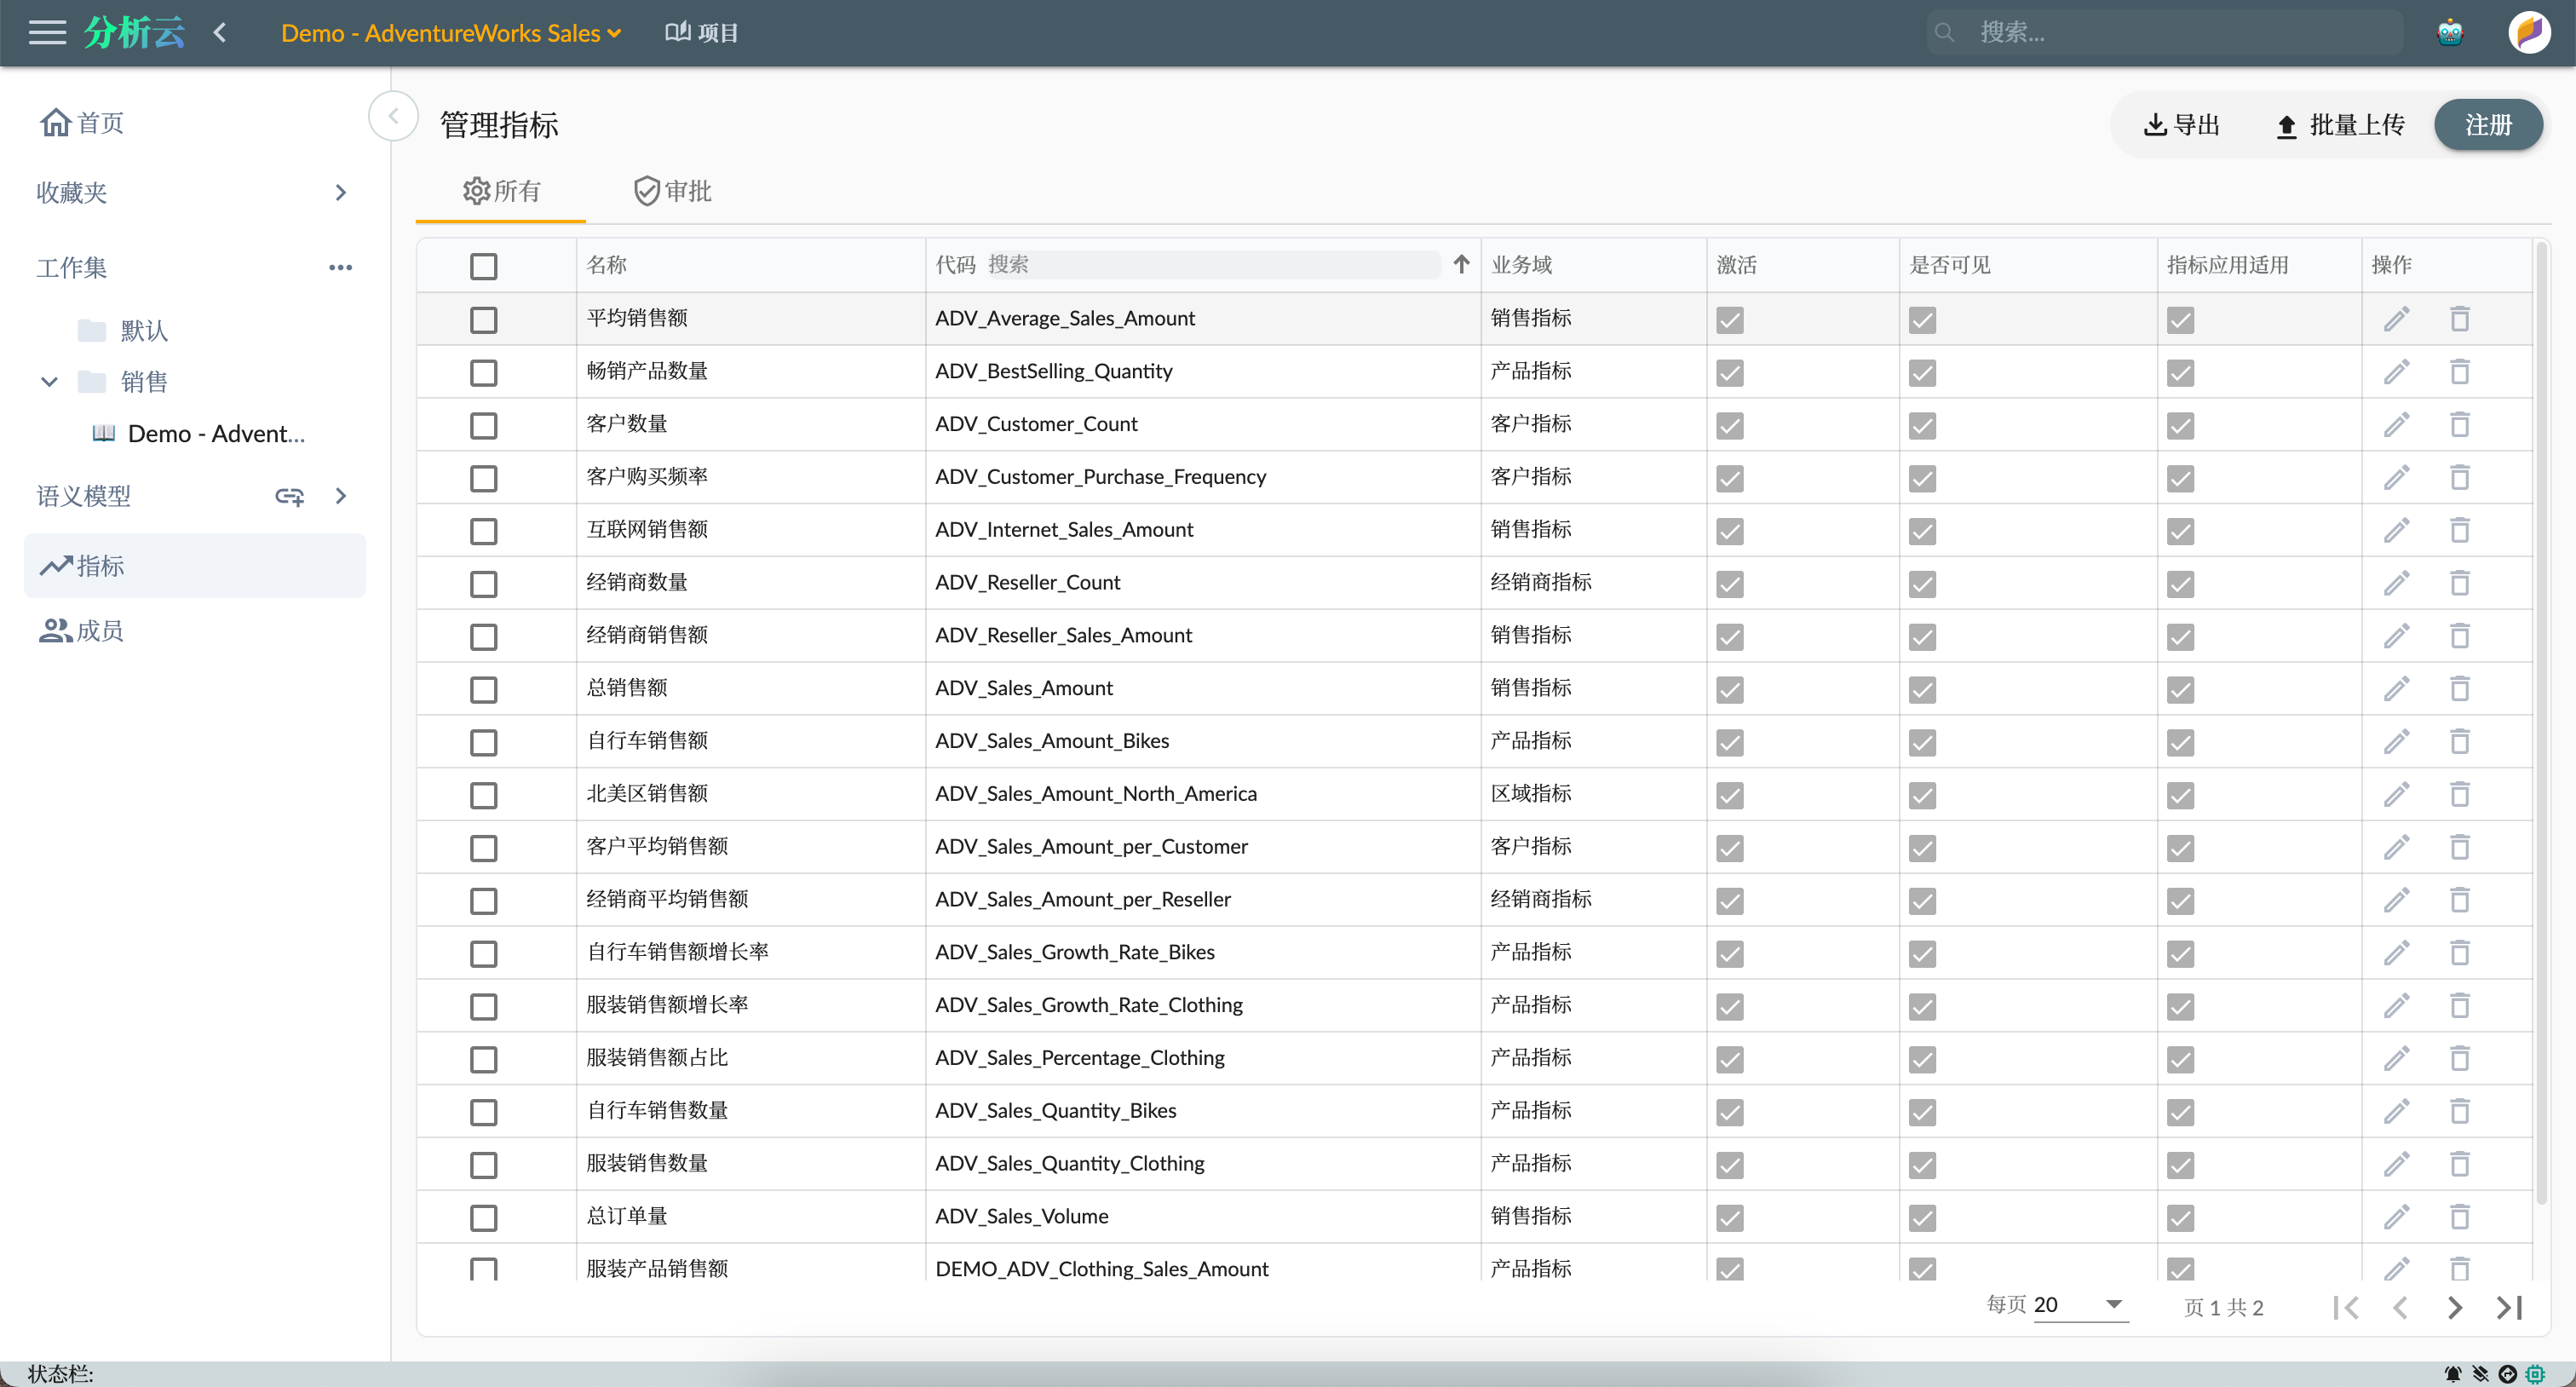
Indicator Management
Next, this article will introduce how to apply for and use the indicator application to view and analyze the indicator data based on the indicator system created in the previous article Sample: AdventureWorks Sales - 3. Indicator Management.
As shown in the figure below, we have created a series of indicators in multiple business areas. When these indicators are activated, users can view and apply for these indicators in the indicator market.
Indicator Market
In the left column of the indicator market page, you can use the filter conditions and find the business area to be browsed. The query conditions of the indicator market are as follows:
- Type: basic indicator, derived indicator
- Tag: Tag list of all indicators, multiple selections can be used to filter indicators
- Business area: the system business area, with business area hierarchy and the number of indicators under it. After selecting a business area, browse the indicator information in this business area in the right column.
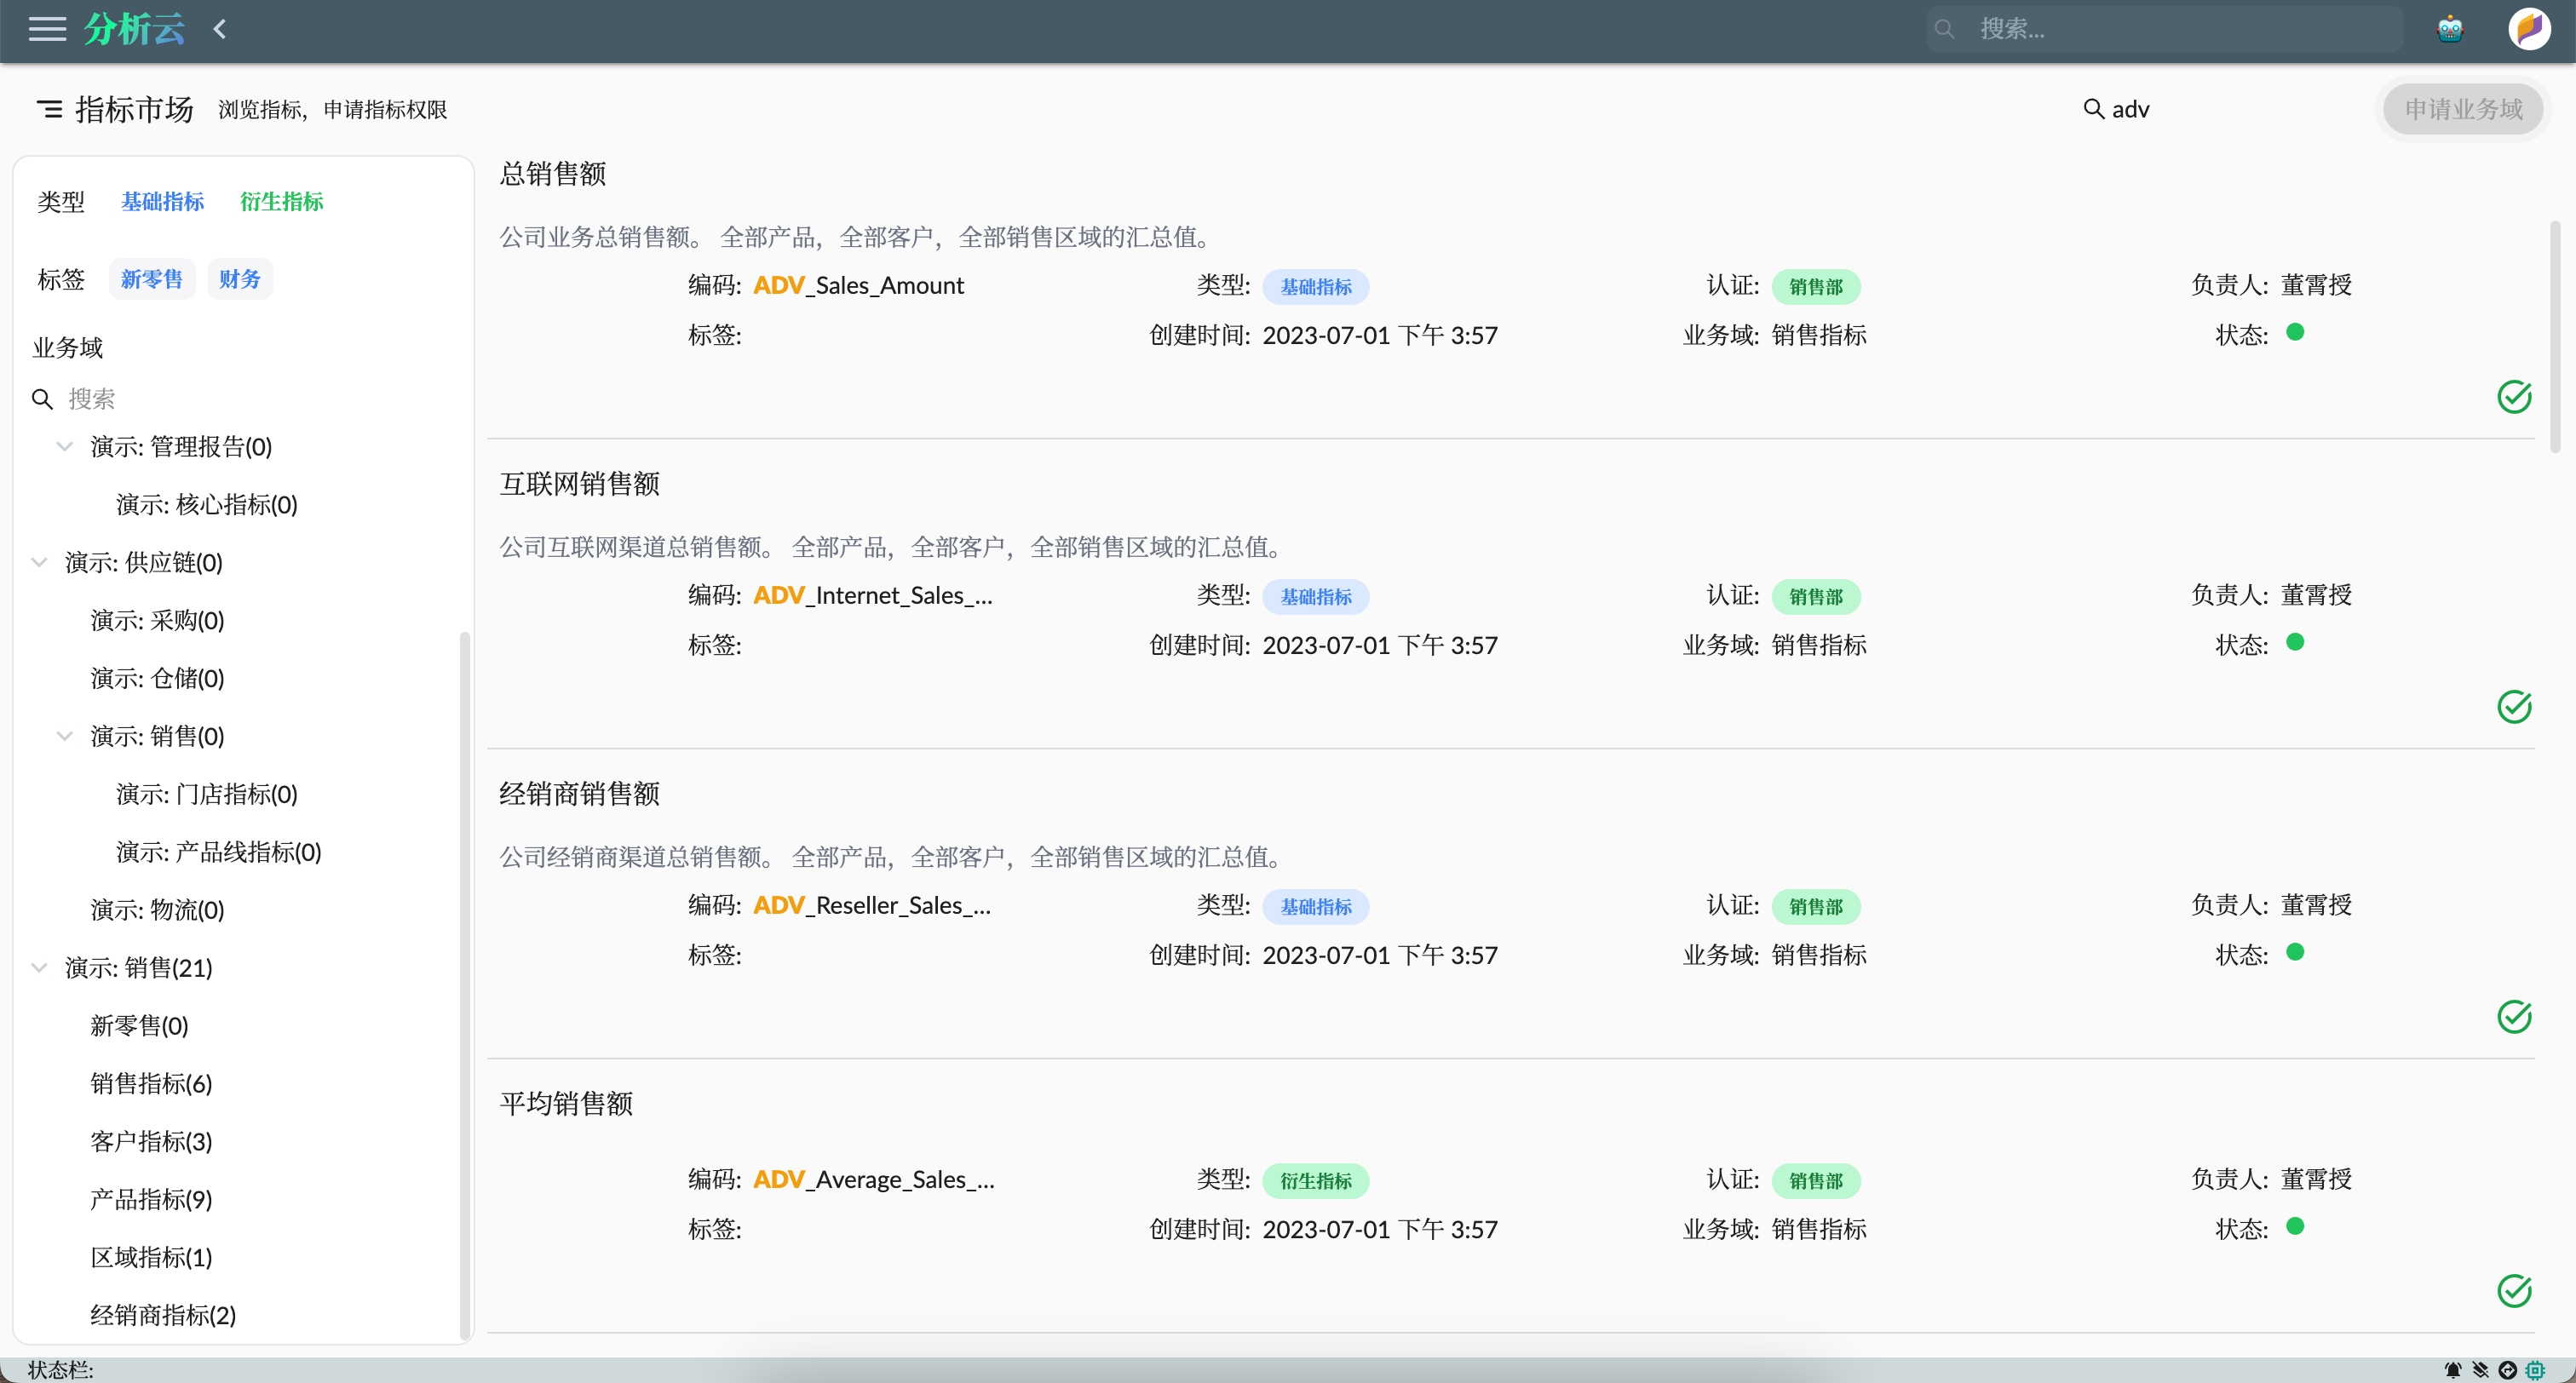
Users can click on the apply button on the indicator to apply for indicator viewing permissions, or click on the business area to apply for authorization of the entire business area within the indicator. Indicators created by the current user do not require apply and permissions are automatically granted by the system.
Indicator Application
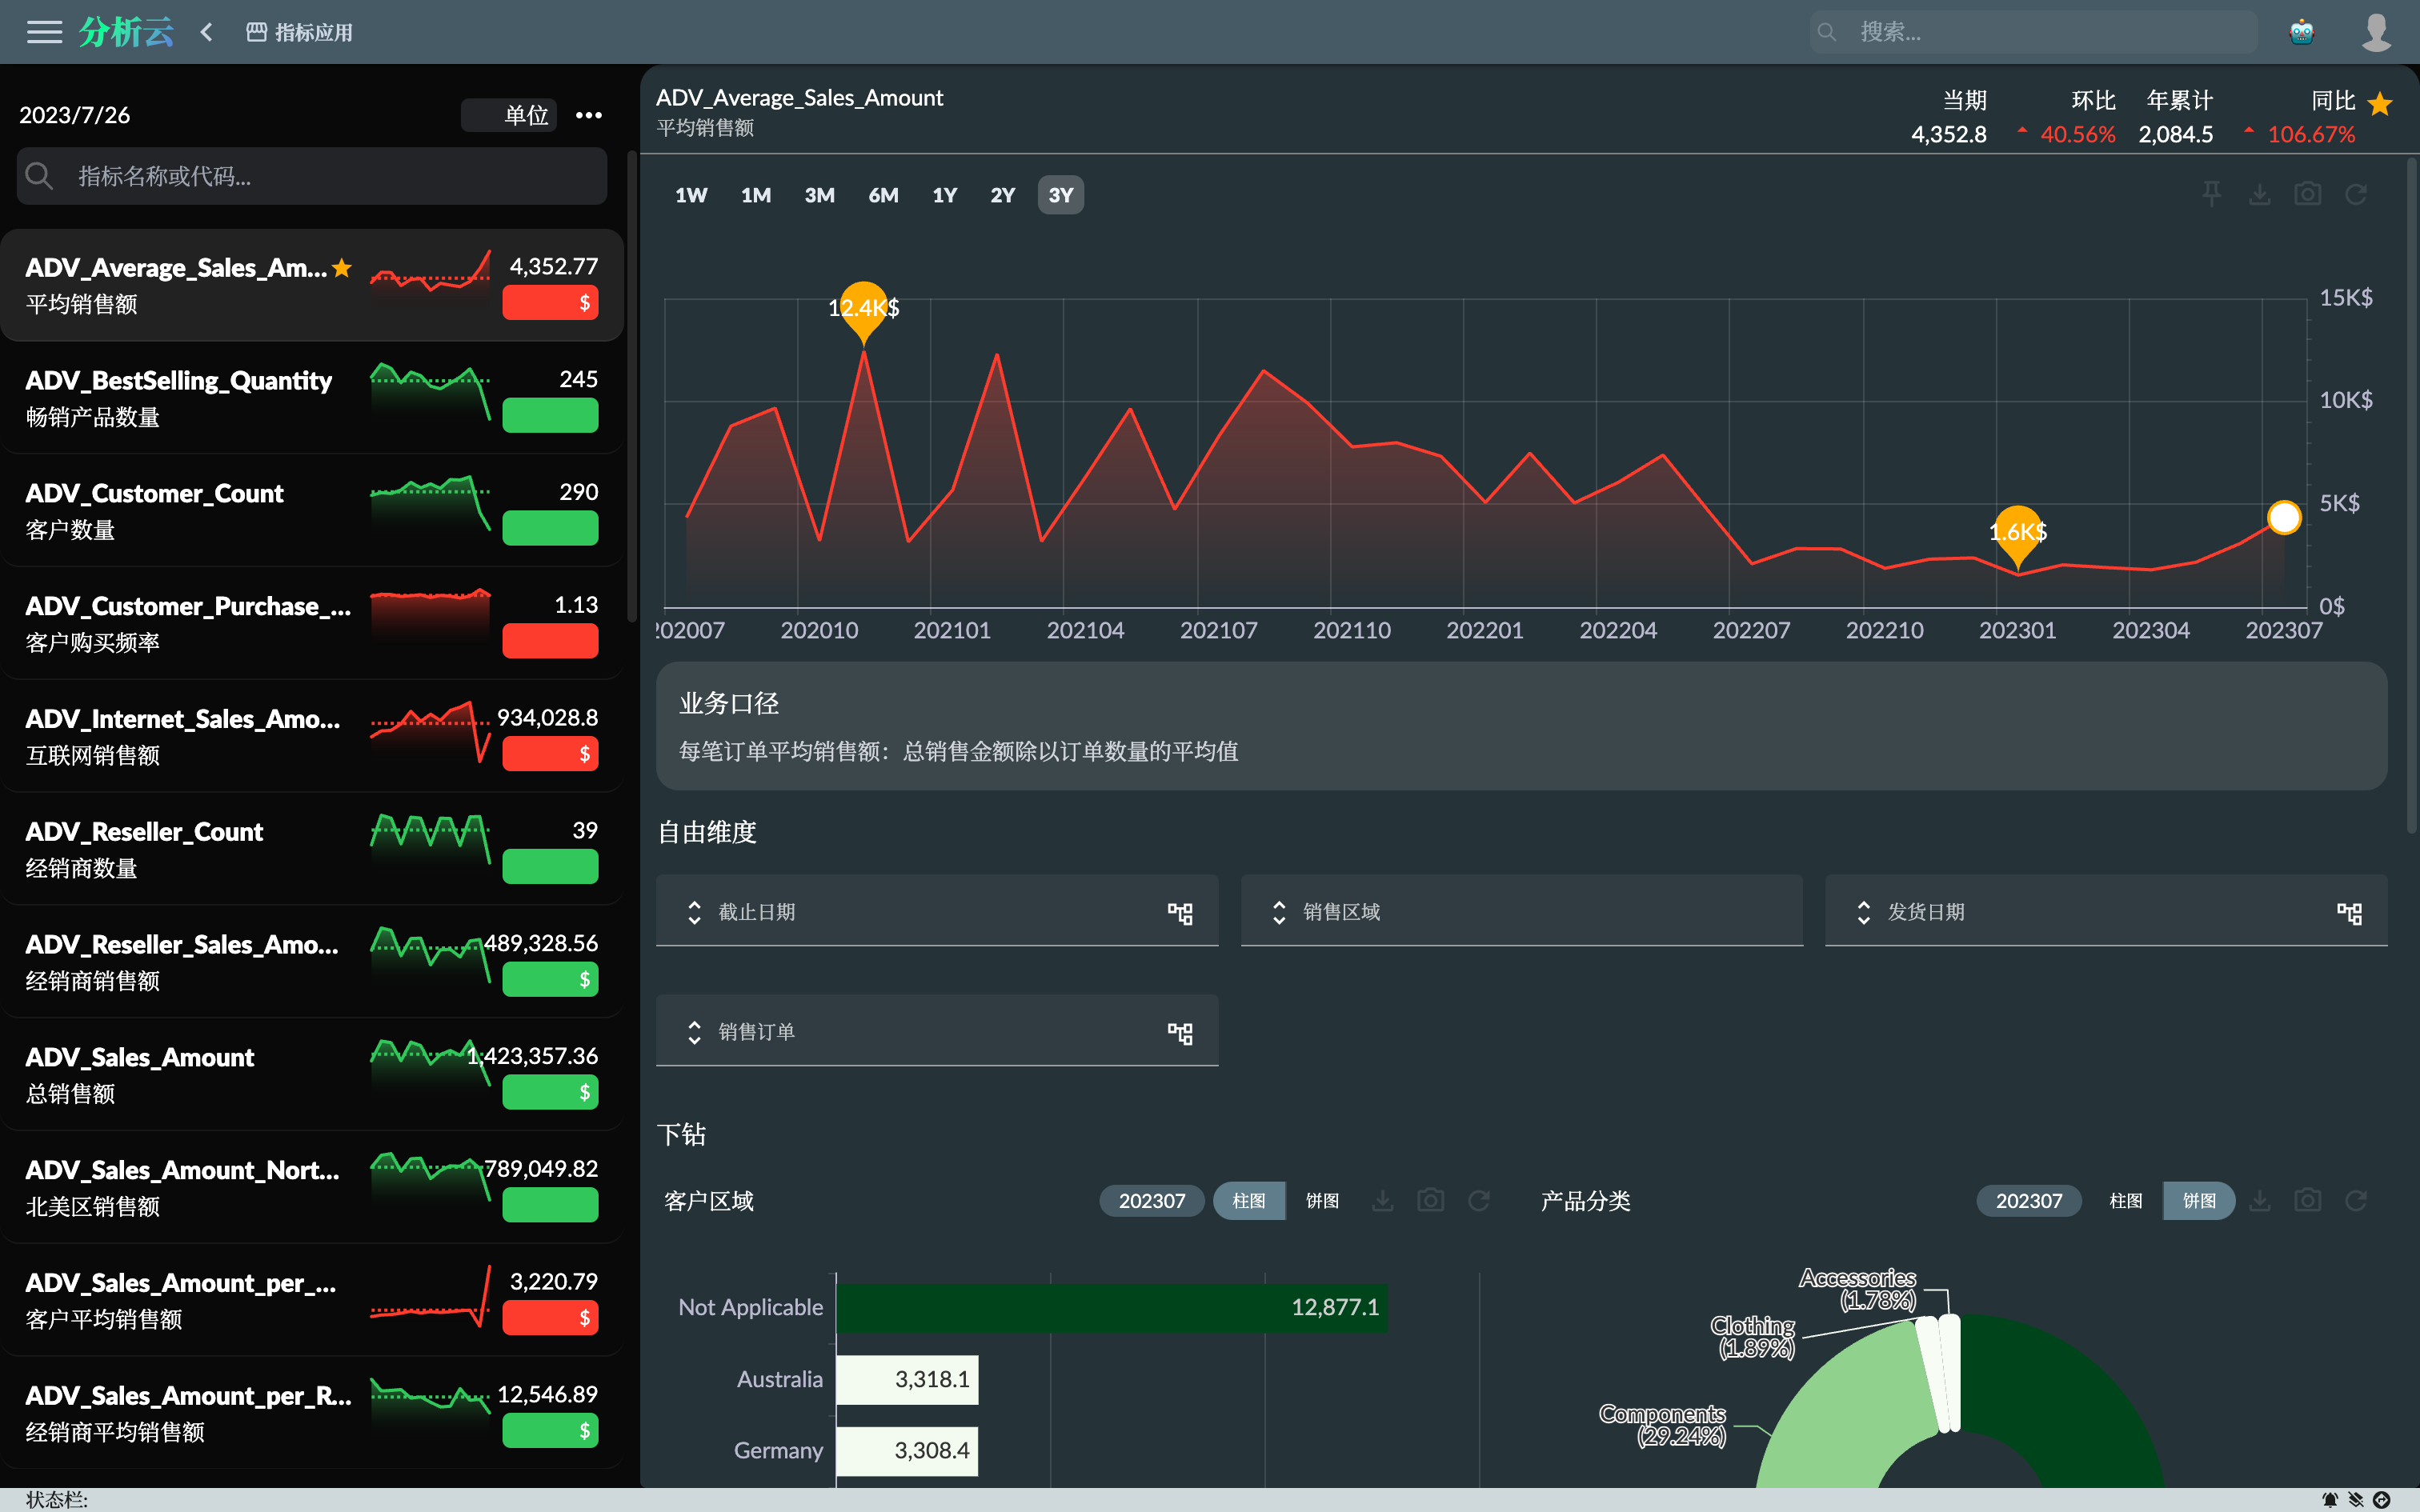
Indicator Application is an application for viewing indicators data. Users can use this application to view, compare, and analyze data from different indicators. The indicators that users apply for in the indicator market can be viewed in the indicator application. Through the indicator application, users can not only monitor the business status of the enterprise in real time, but also analyze the indicators in detail, so as to better formulate strategic plans.
You can use the search box to find relevant indicators by indicator code or name, click on the indicator to open the indicator details page for viewing, and click the collection button to collect the indicator and display it at the top of the list for quick viewing.

Free Dimensions
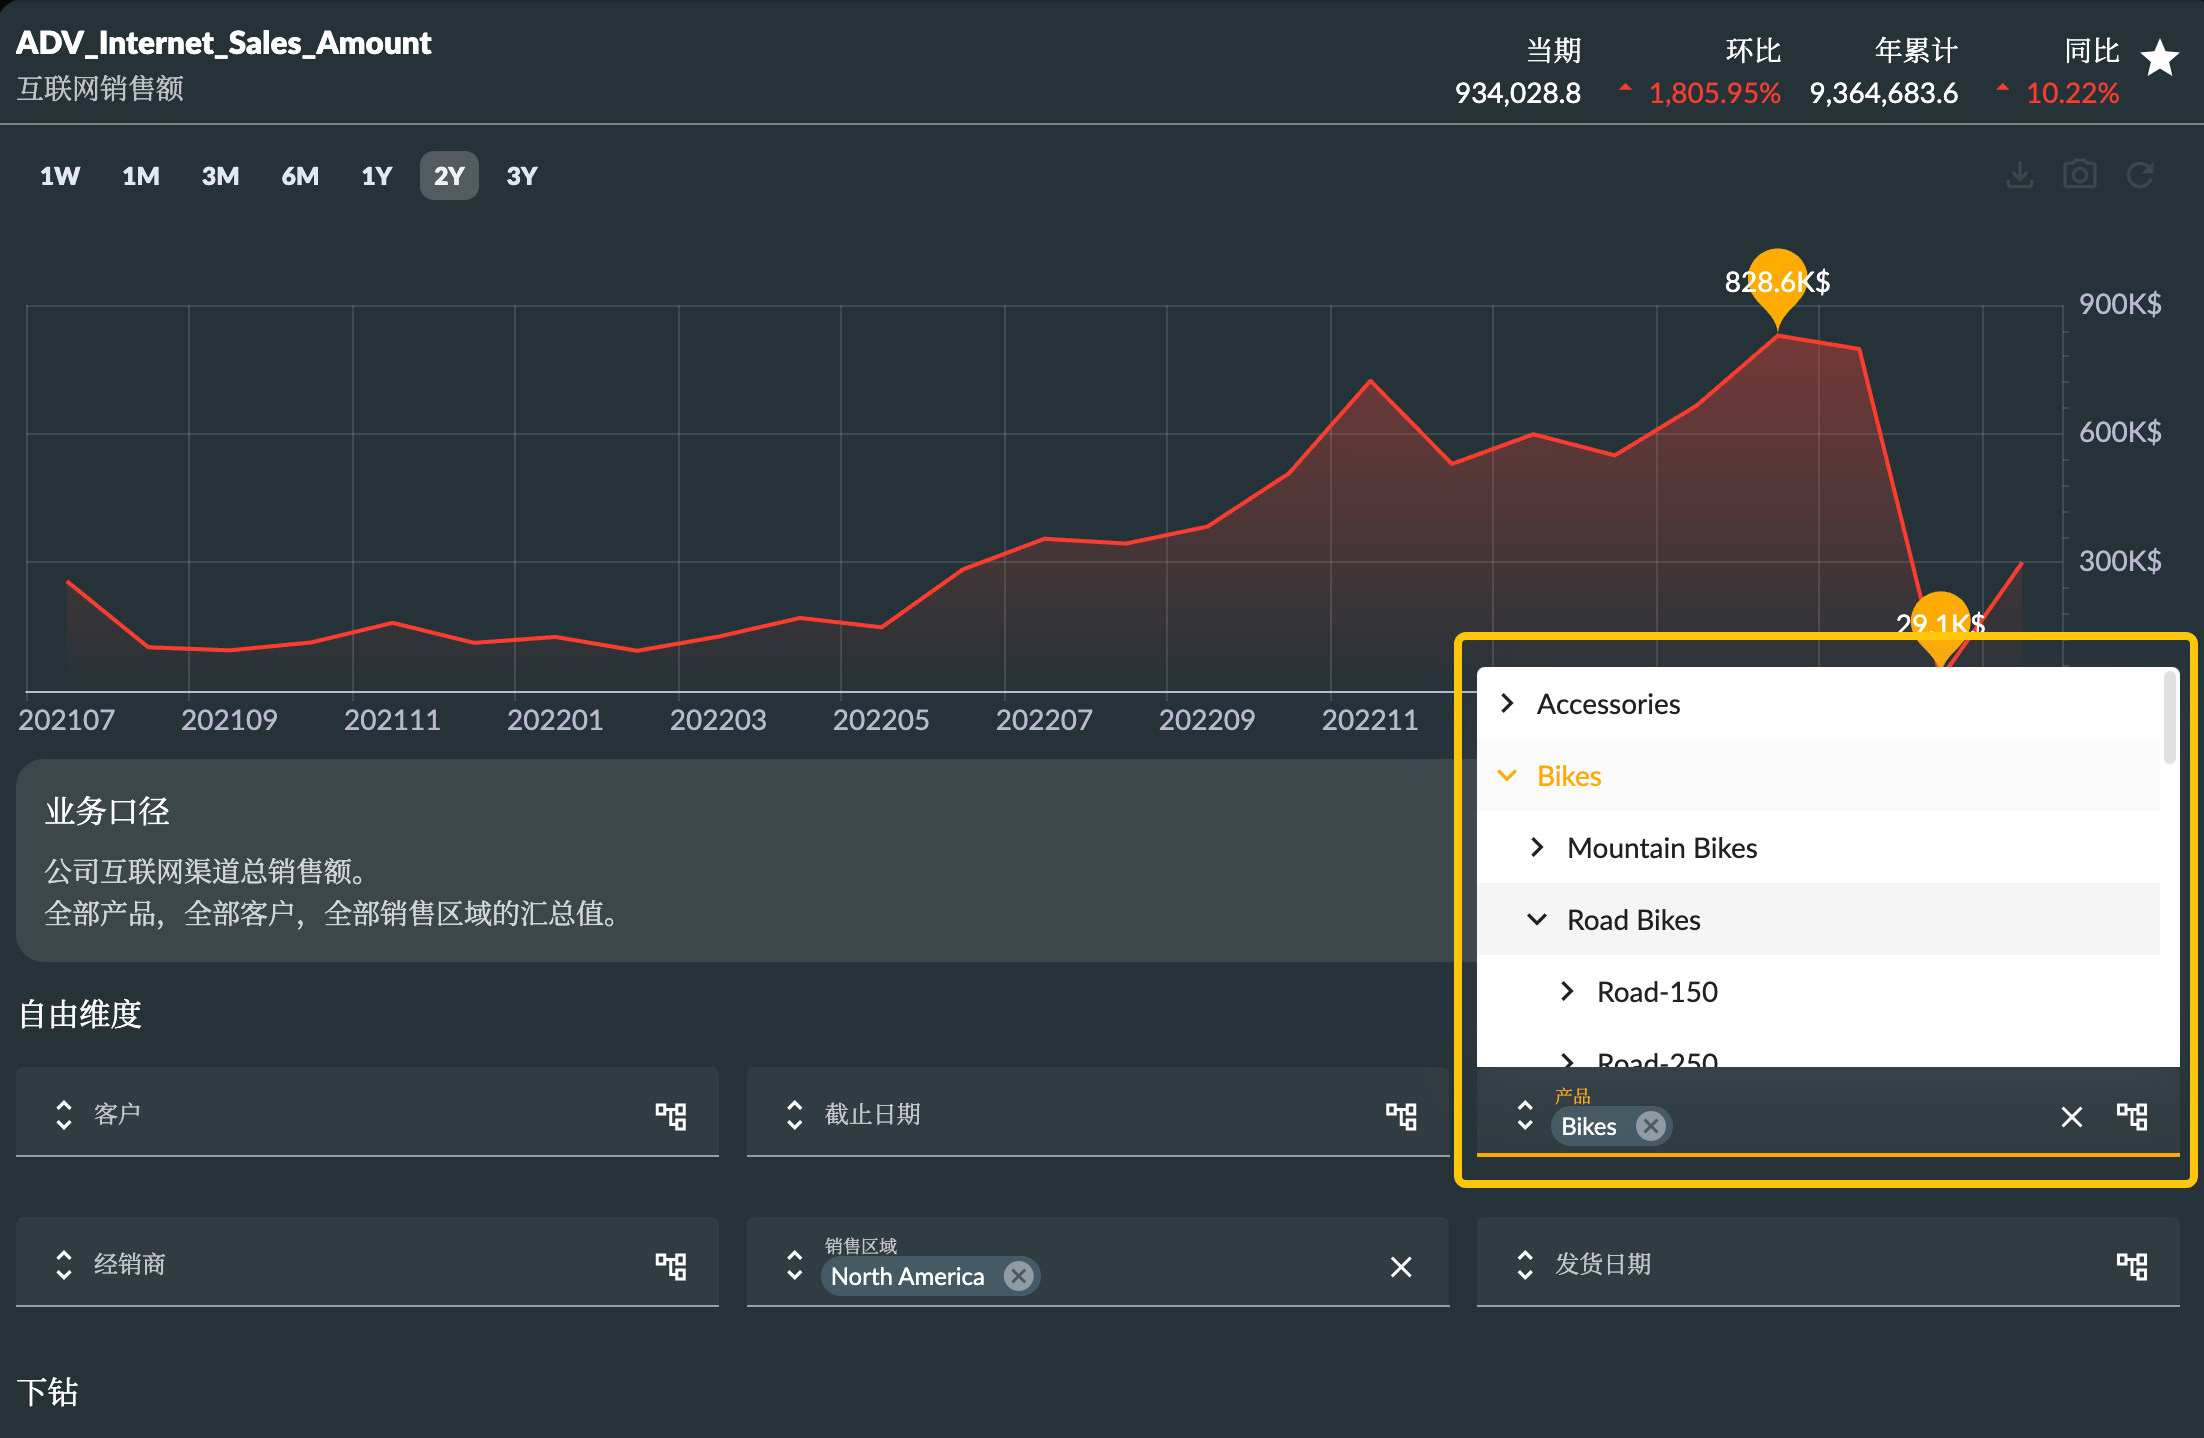
Free Dimensions You can set the filtering conditions for the free dimension to analyze the influence of other factors in addition to the limiting conditions of the indicators themselves. Free dimensions are derived from the list of free dimensions set at the time of indicator registration.
- The dimension members selector supports the search function, which can search by the name or key value of the dimension member
- Currently only supports single selection dimension members
- Support switching the hierarchies of dimensions (if any)
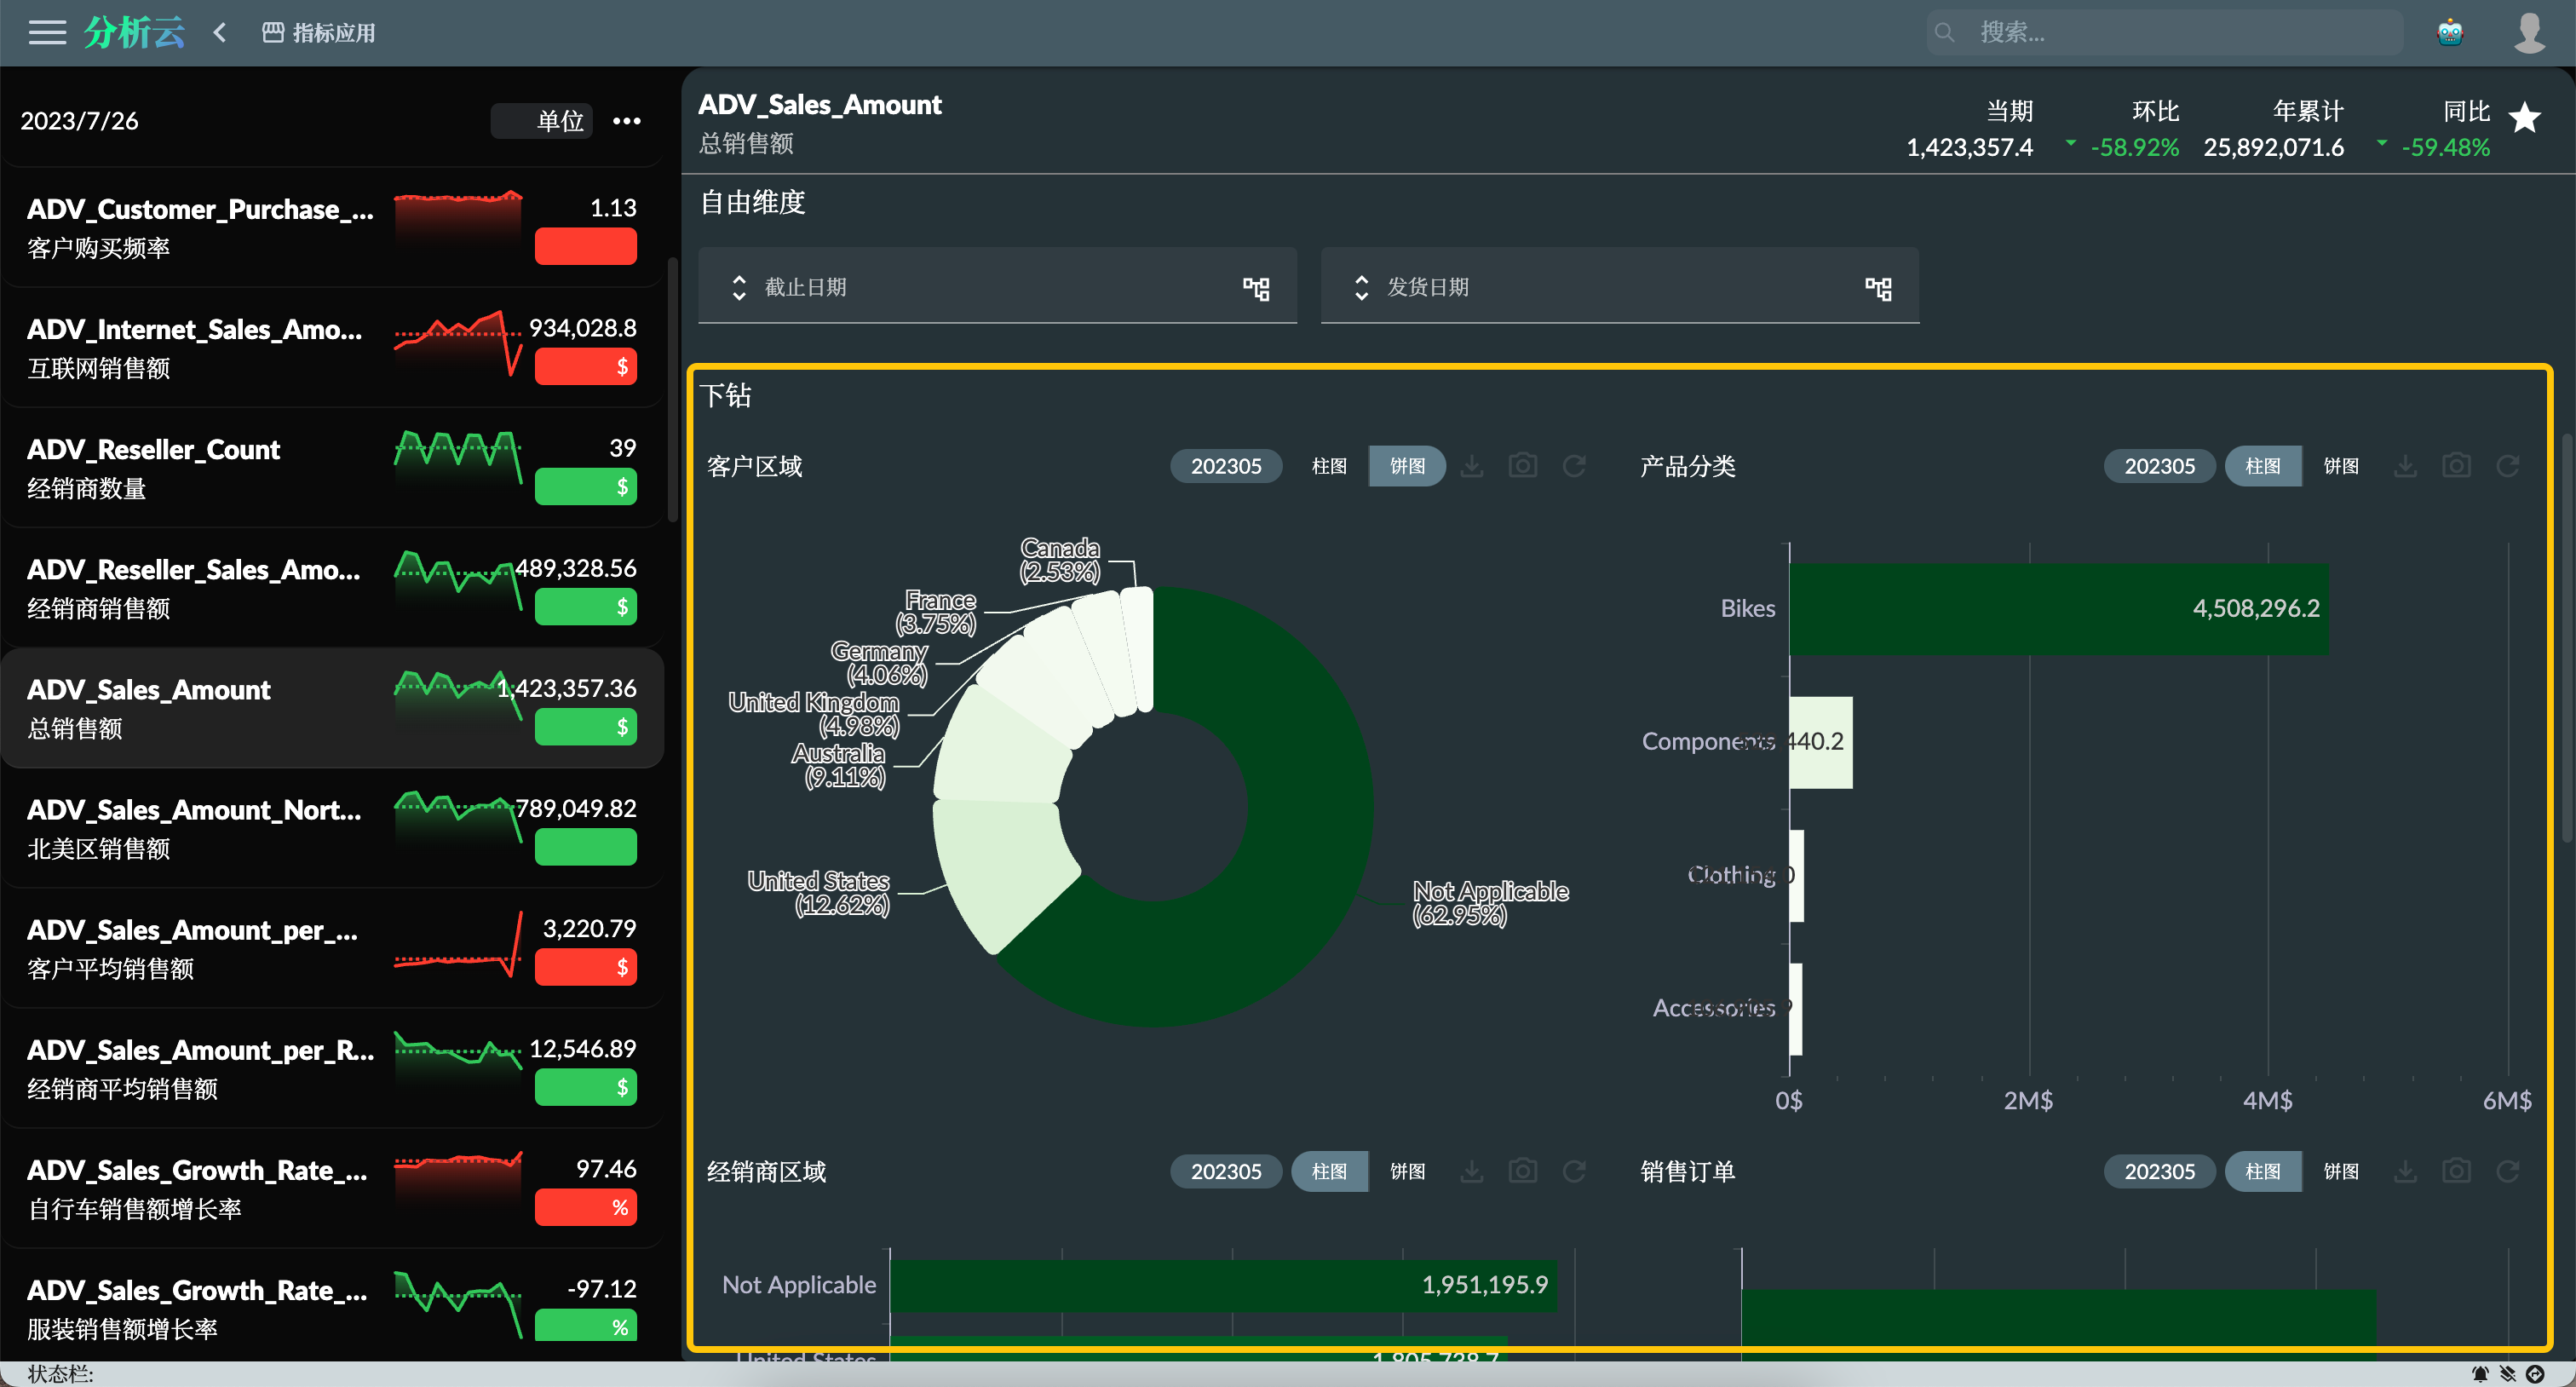
Drill Down
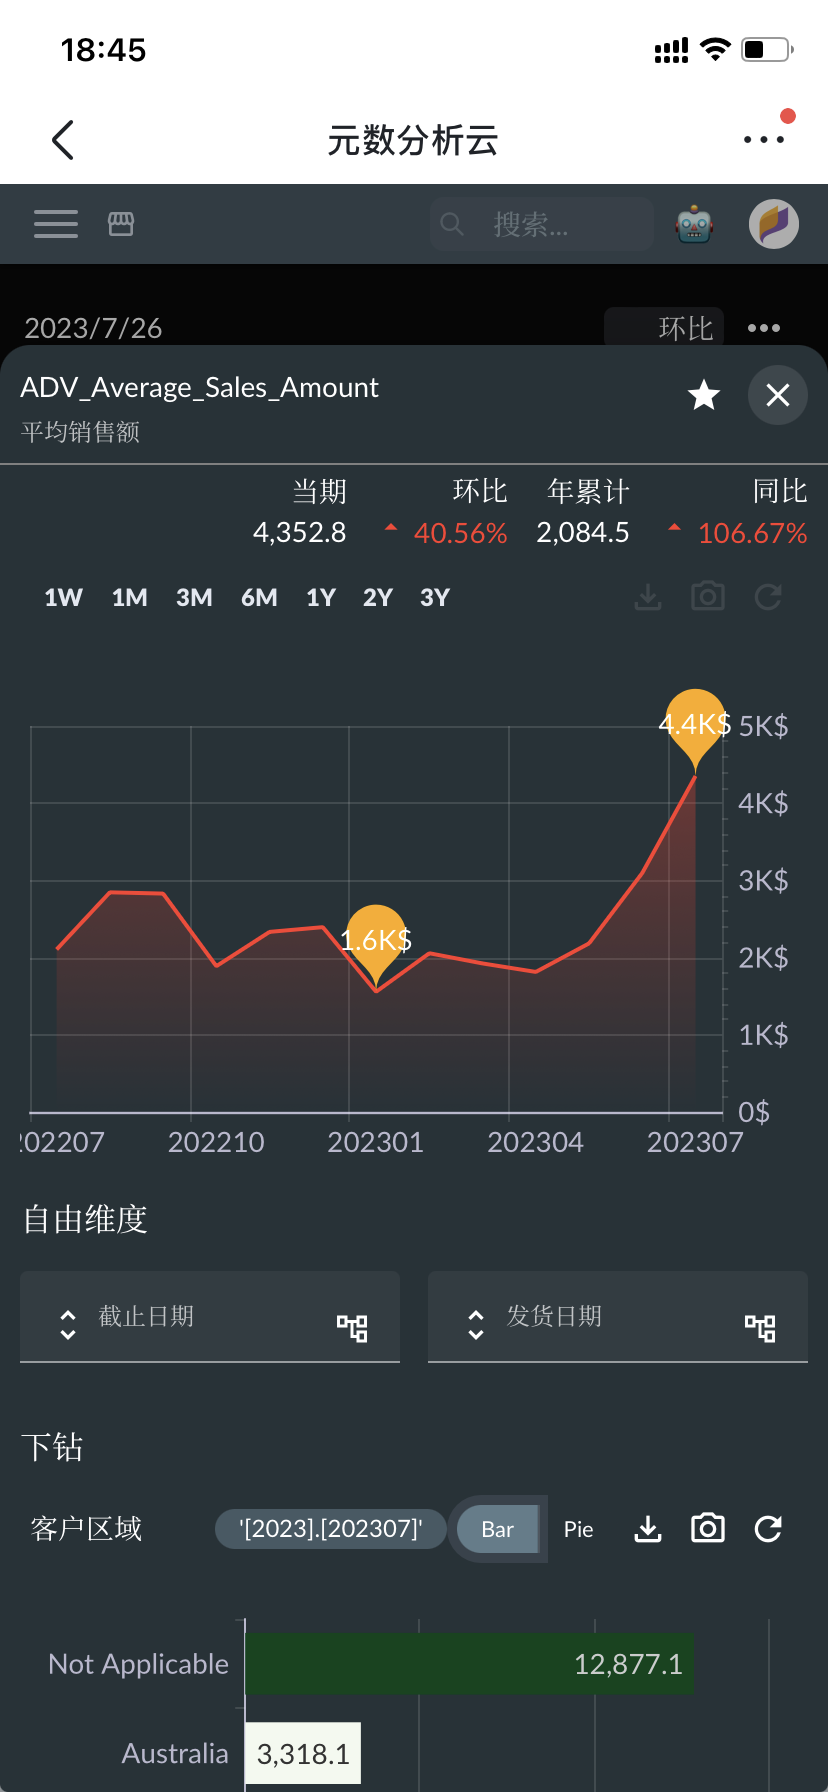
The free dimension in the indicator details represents the dimension that can be further analyzed in addition to the limiting conditions of the current indicator. Users can choose different dimensions for analysis according to their needs. The drilling area represents the composition of the current indicator's limiting conditions, that is, the data composition of the next-level member of the current limiting condition, which is conducive to the user's analysis of the data source of the current indicator.
- Selecting different time periods in the indicator trend chart can filter the drilling chart data
- The drilling chart has two types of bar chart and pie chart, which can switch the relationship and ranking of the data time of the graph
- Clicking on the graphic data item can further drill down to the next level of data (if any)
Comments
The indicator comments function is a collaboration and communication tool that can promote interaction, discussion and cooperation between users in data and indicator analysis. Through the comment function, users can better understand the meaning of the data, share insights and experiences, and correct errors in time, so as to better use the data to support decisions and business.
AI Copilot
AI Copilot is an artificial intelligence tool for indicator data analysis, which can help users analyze the current indicator data situation and let artificial intelligence give the answer to the question you raised.
Refer to the document Xpert Copilot to enable AI Copilot function.
Feishu Integration
Integrating metrics into OA (office automation) software such as Feishu can enhance team collaboration efficiency and decision-making capabilities, improve work efficiency, and make data-driven decisions more convenient and accurate.
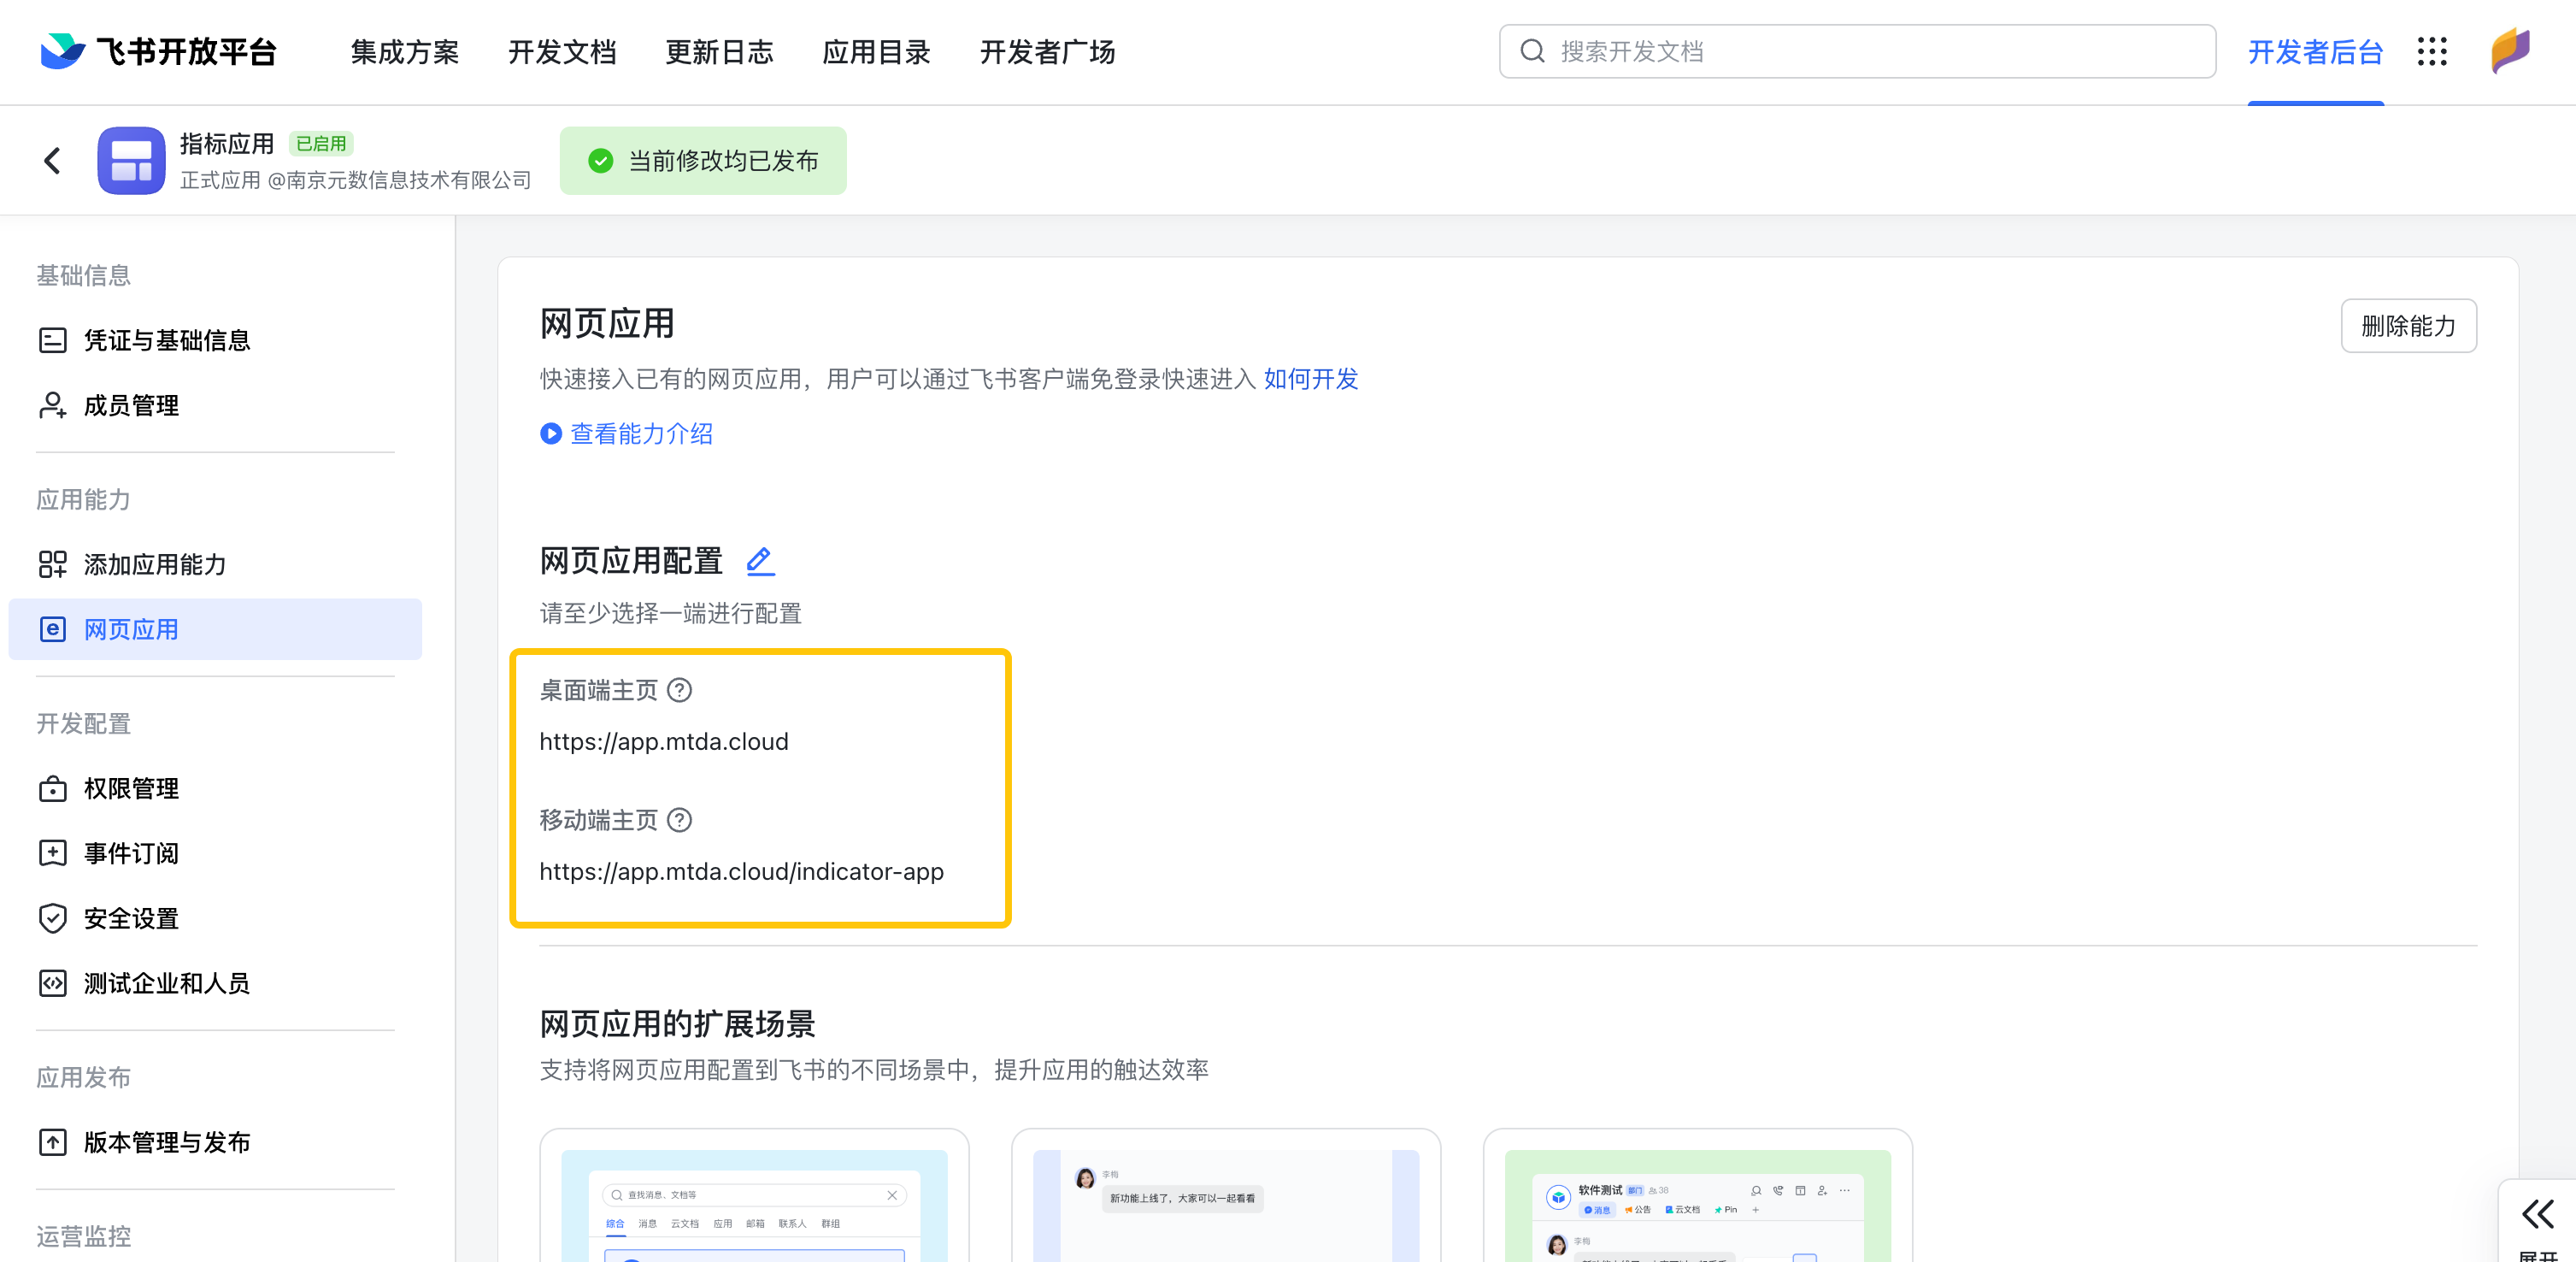
Go to the Feishu Developer Console, create an Enterprise Self-built Application, fill in the basic information of the application, and fill in the web application configuration in the web application function, and fill in the desktop and mobile home page URLs. After creating the application, you can publish it.
If it is the Xpert Analytics Cloud deployed by the enterprise, replace the domain name with the domain name deployed by the enterprise.
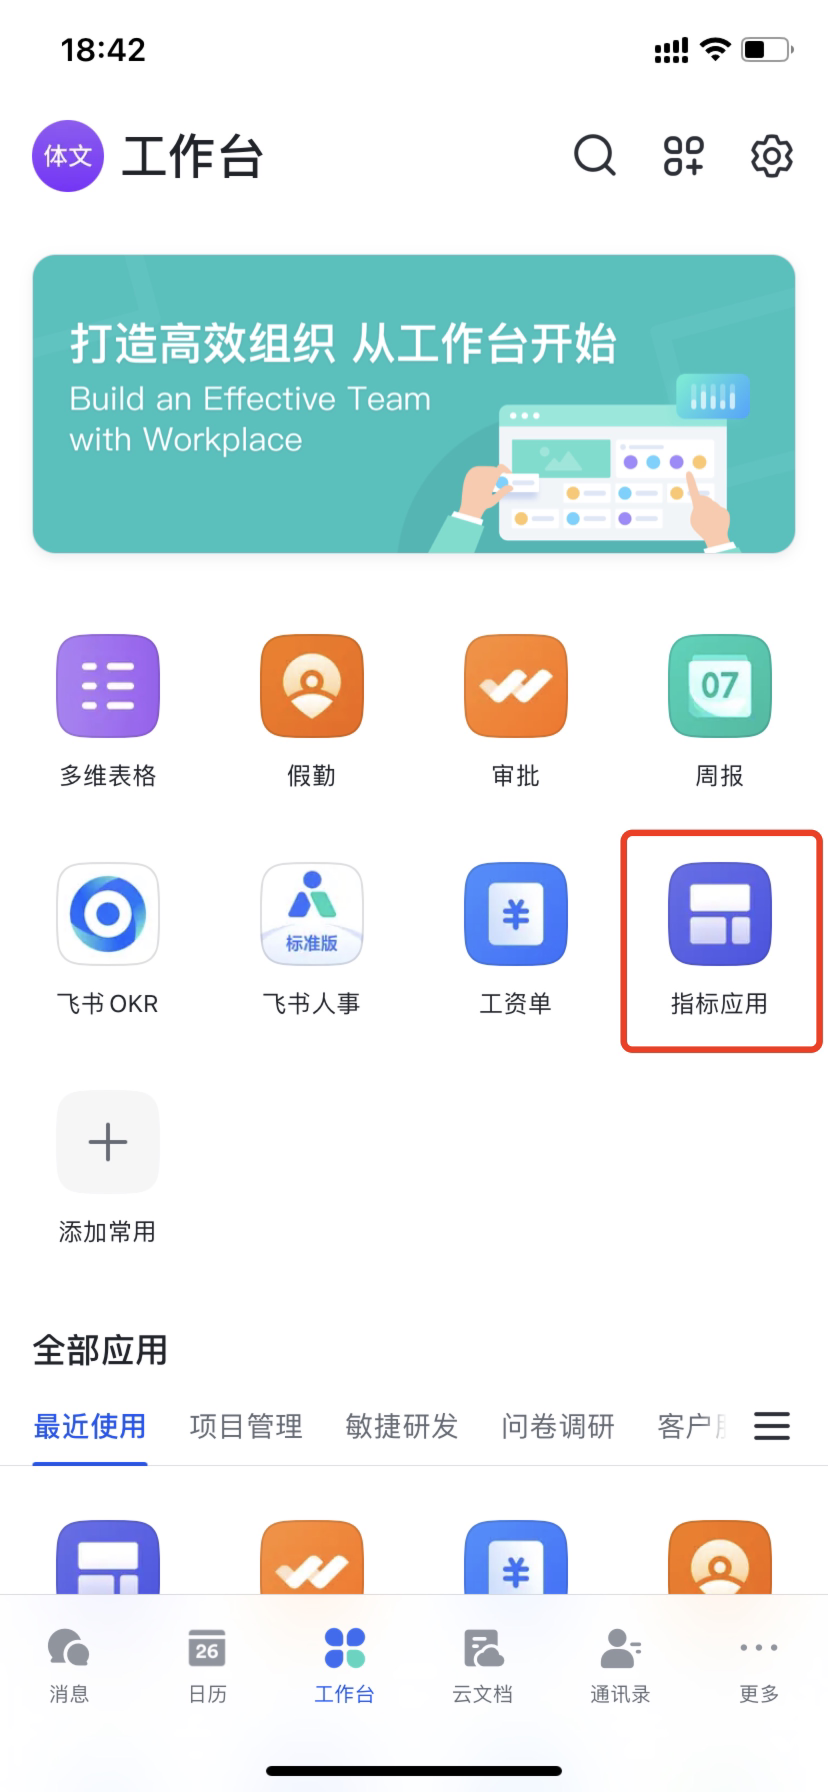
After publishing and assigning permissions to Feishu users, users can see the metric application in the Feishu workbench.
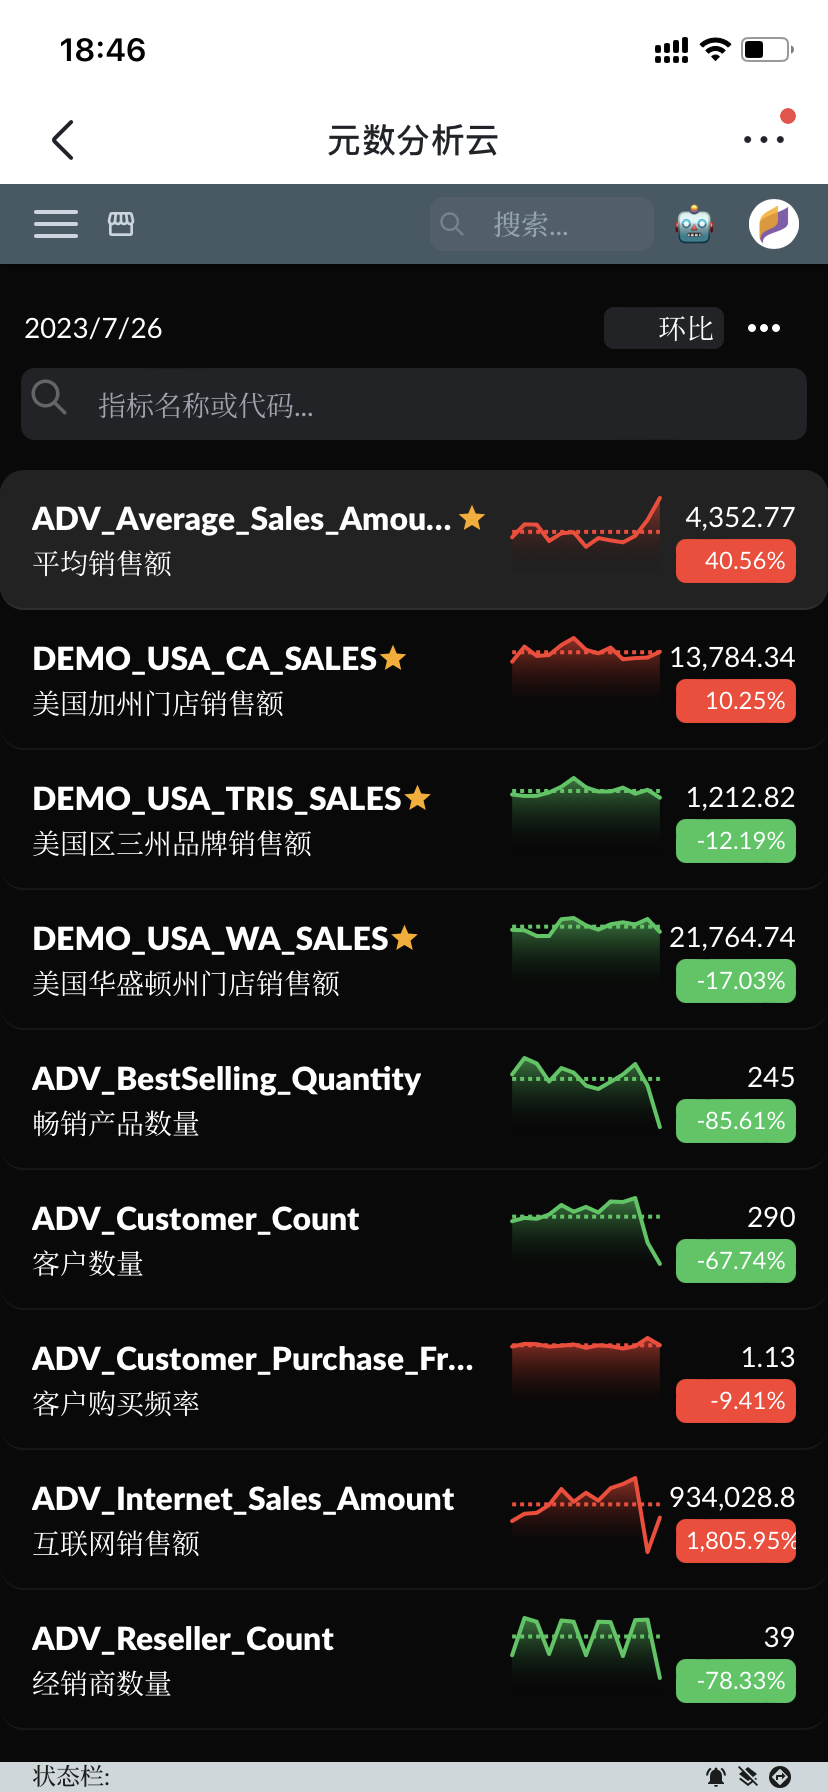
Open the Feishu indicator application, log in to the Xpert Analytics Cloud account, and you can view the indicator data in Feishu.
The function of Xpert Analytics Cloud and Feishu and other office software will be introduced in detail later.
Summary
This article introduces the use of the indicator application in the Meta number analysis cloud. The indicator application is an application page for displaying indicator data. Users can use this application to view, compare and analyze data of different indicators. The indicators applied by users in the indicator market can be viewed in the indicator application.
Enterprises can also integrate the indicator application into OA (office automation) software such as Feishu to better collaborate and make decisions.