Xpert analytics cloud relies on semantic models to have powerful indicator management functions, aiming to help users effectively manage and monitor indicators in data models. Xpert analytics cloud builds a unified semantic modeling of enterprise data through a core OLAP engine, without cumbersome data conversion and ETL, and unifies the definition of indicators to manage and certify enterprise business data. Finally, through the indicator application and story dashboard provided by Xpert analytics cloud, the indicators are used to analyze and evaluate the company's business and financial data.
This article will use the indicator management function of Xpert analytics cloud to define a complete set of indicator management systems for the AdventureWorks Sales data model.
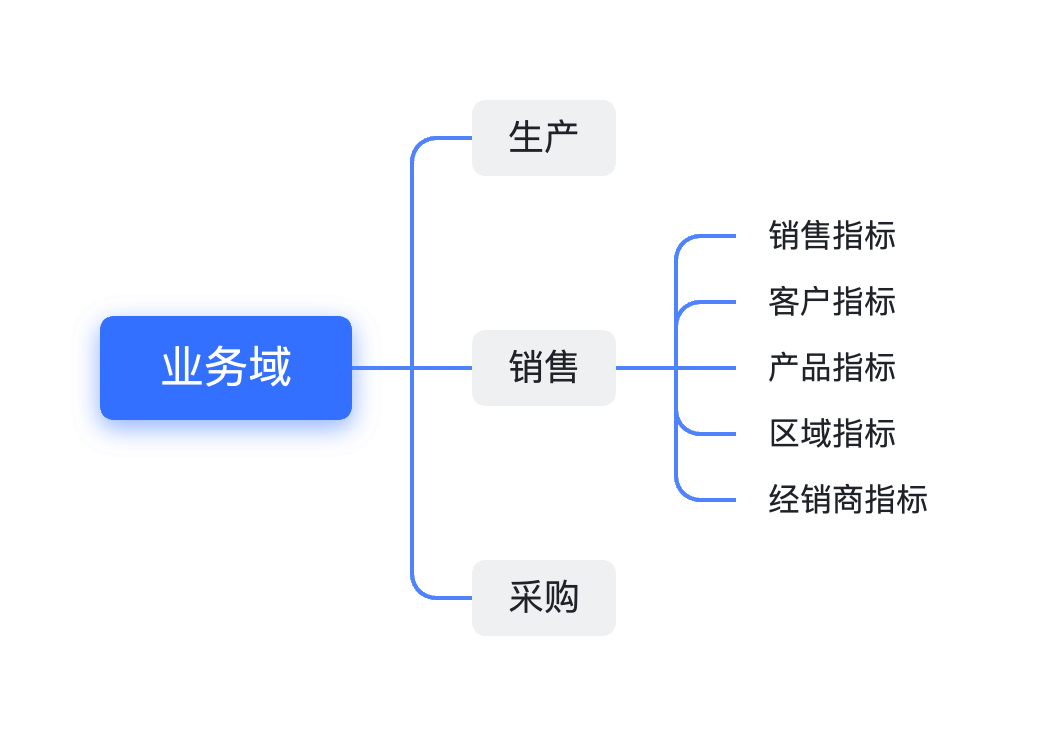
Indicator System Design
We will now create a set of indicators for AdventureWorks Sales data set to demonstrate the functionality of Xpert Cloud indicator management. The previous Sample: AdventureWorks Sales - 1. Modeling created the AdventureWorks Sales multidimensional data set, which contains dimensions:
- Reseller;
- Customer;
- Sales Territory;
- Date;
- Product;
- Sales Order;
and measures:
- Sales Quantity;
- Sales Amount;
- Total Product Cost;
- Unit Price;
- Profit;
Here is a relatively complete set of indicators, covering sales, resellers, customers and products:
Sales indicators:
- Sales Amount: Total sales amount
- Sales Quantity: Total sales quantity
- Total Order Volume: Total number of orders
- Average Unit Price: The average value of sales amount divided by sales quantity
- Sales Amount Per Order: The average value of sales amount divided by the number of orders
- Internet Sales Amount: Sales amount of Internet channel
- Reseller Sales Amount: Sales amount of distributor channel
Customer indicators:
- Customer Count: Total number of customers
- Customer Grand Count: Total number of customers up to the current time
- Customer Purchase Frequency: Average number of orders per customer
- Sales Amount per Customer: Average order purchase amount per customer
Product indicators:
- Product Quantity: The sales quantity of each product
- Best Selling Product Quantity: The quantity of the best-selling products in the specified time range
- Product Sales Growth Rate: The growth rate of product sales in adjacent time periods
- Product Sales Percentage: The percentage of sales of each product in total sales
Region indicators:
- Region Sales Amount: Sales amount divided by region
- Region Sales Quantity: Sales quantity divided by region
- Region Sales Growth Rate: The growth rate of regional sales in adjacent time periods
- Region Sales Percentage: The percentage of sales amount of each region in total sales
Reseller indicators:
- Reseller Sales Amount: The total sales amount of the reseller
- Reseller Sales Quantity: The total sales quantity of the reseller
- Sales Amount per Reseller: The average sales amount of the reseller
- Reseller Order Count: The number of orders of the reseller
- Reseller Sales Percentage: The percentage of the reseller's sales in total sales
- Reseller Active Customer Count: The number of customers with transaction records of the reseller in the specified time range
These indicators will help you understand the reseller's sales performance, market, customer activity and other key metrics. You can adjust and expand them according to specific needs and analysis objectives to meet your business needs.
Business Area
The business area refers to the division and organization of business areas or business functions. It represents different business departments, business processes or business functions of the enterprise, such as sales, procurement, production, human resources, etc. Each business area usually contains a set of related indicators and models to measure and monitor the performance and performance of the business area. Business domain is an effective way to organize and divide the indicator system. Usually, logically related indicator sets are divided into the same business domain.
According to the above indicator system design, the sales business domain is divided into the following sub-business domains:

For more information about business area, see Business Area.
Manage Indicators
Next, we will demonstrate how to create relevant indicators for the above indicator system in the Xpert analytics cloud system.
Project
The management of indicator creation and maintenance in the Xpert analytics cloud is carried out in units of 🧰 project. Before creating an indicator, you need to create a project (or use the default project), and then create an indicator in the project.
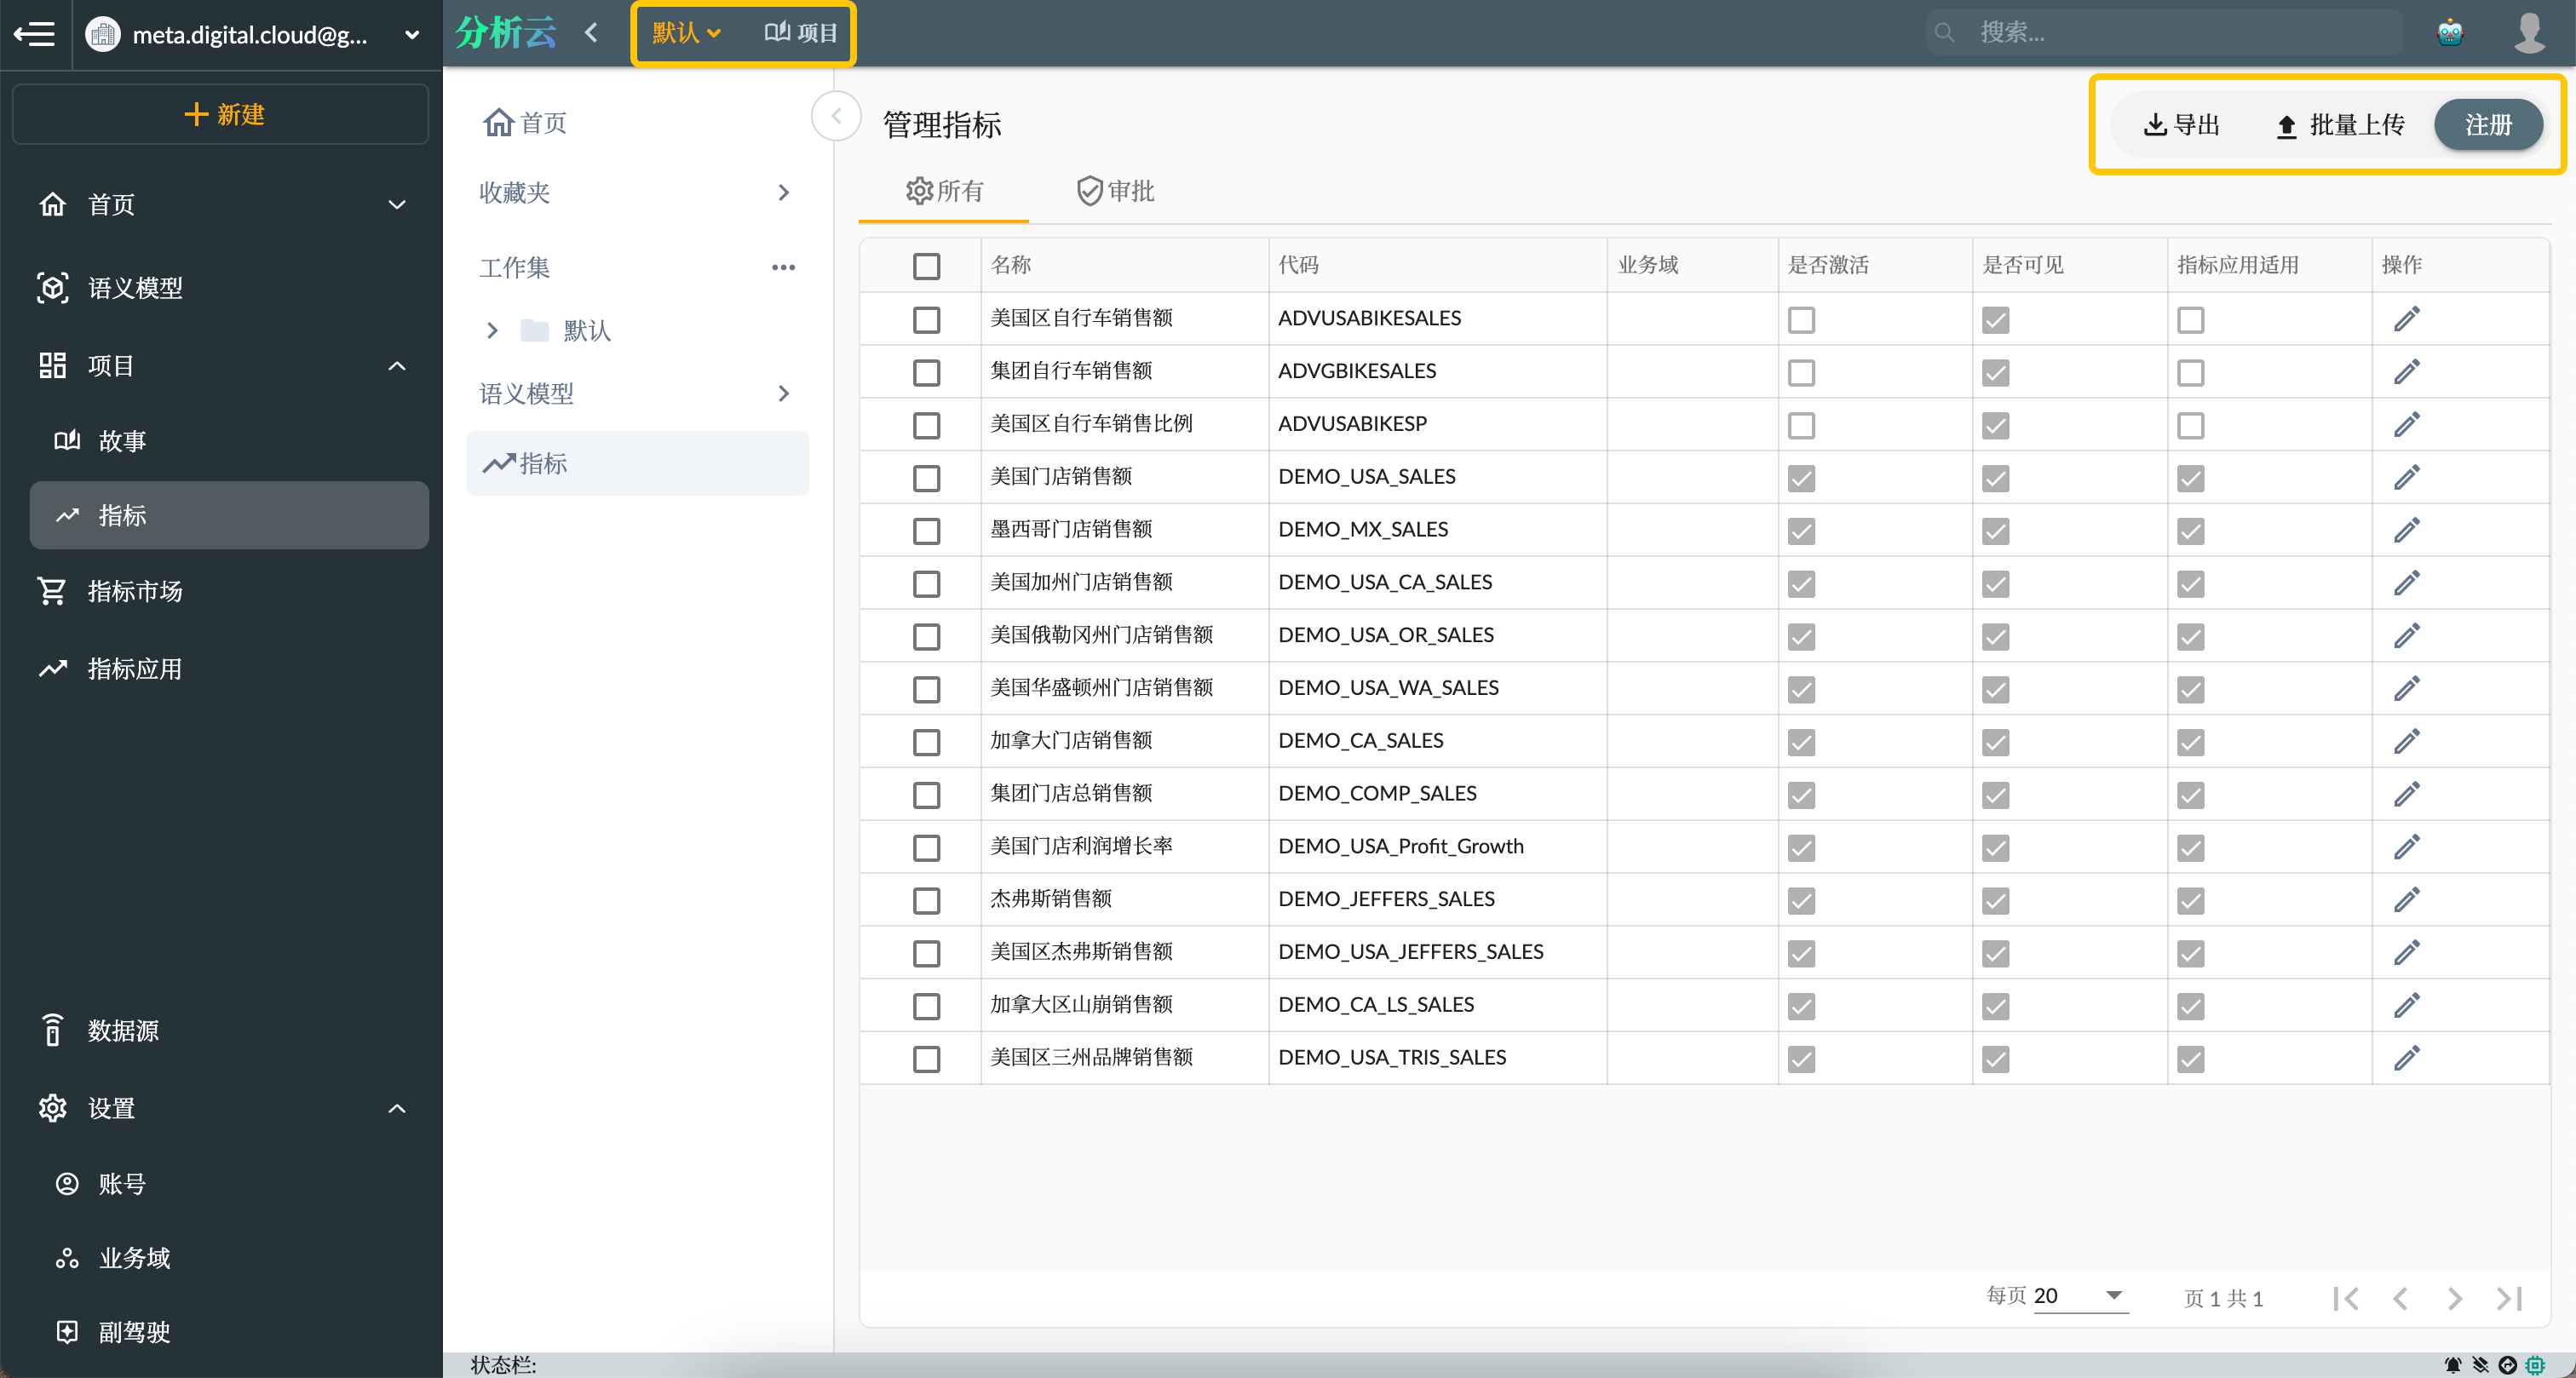
As shown in the figure below, click the "Project" -〉 "Indicators" menu in the website navigation menu to go to the indicator management page, where the project uses the default project. In the indicator management toolbar, you can register indicators, import indicators in batches, and export indicators.
Time Dimension
Time dimensions are usually defined in the indicator management to help users analyze and compare the changes in the metrics more conveniently. For example, you can define the time dimension of the indicator as "year", "quarter", "month", "week", "day", etc., so that users can analyze the changes in the indicator according to different time dimensions.
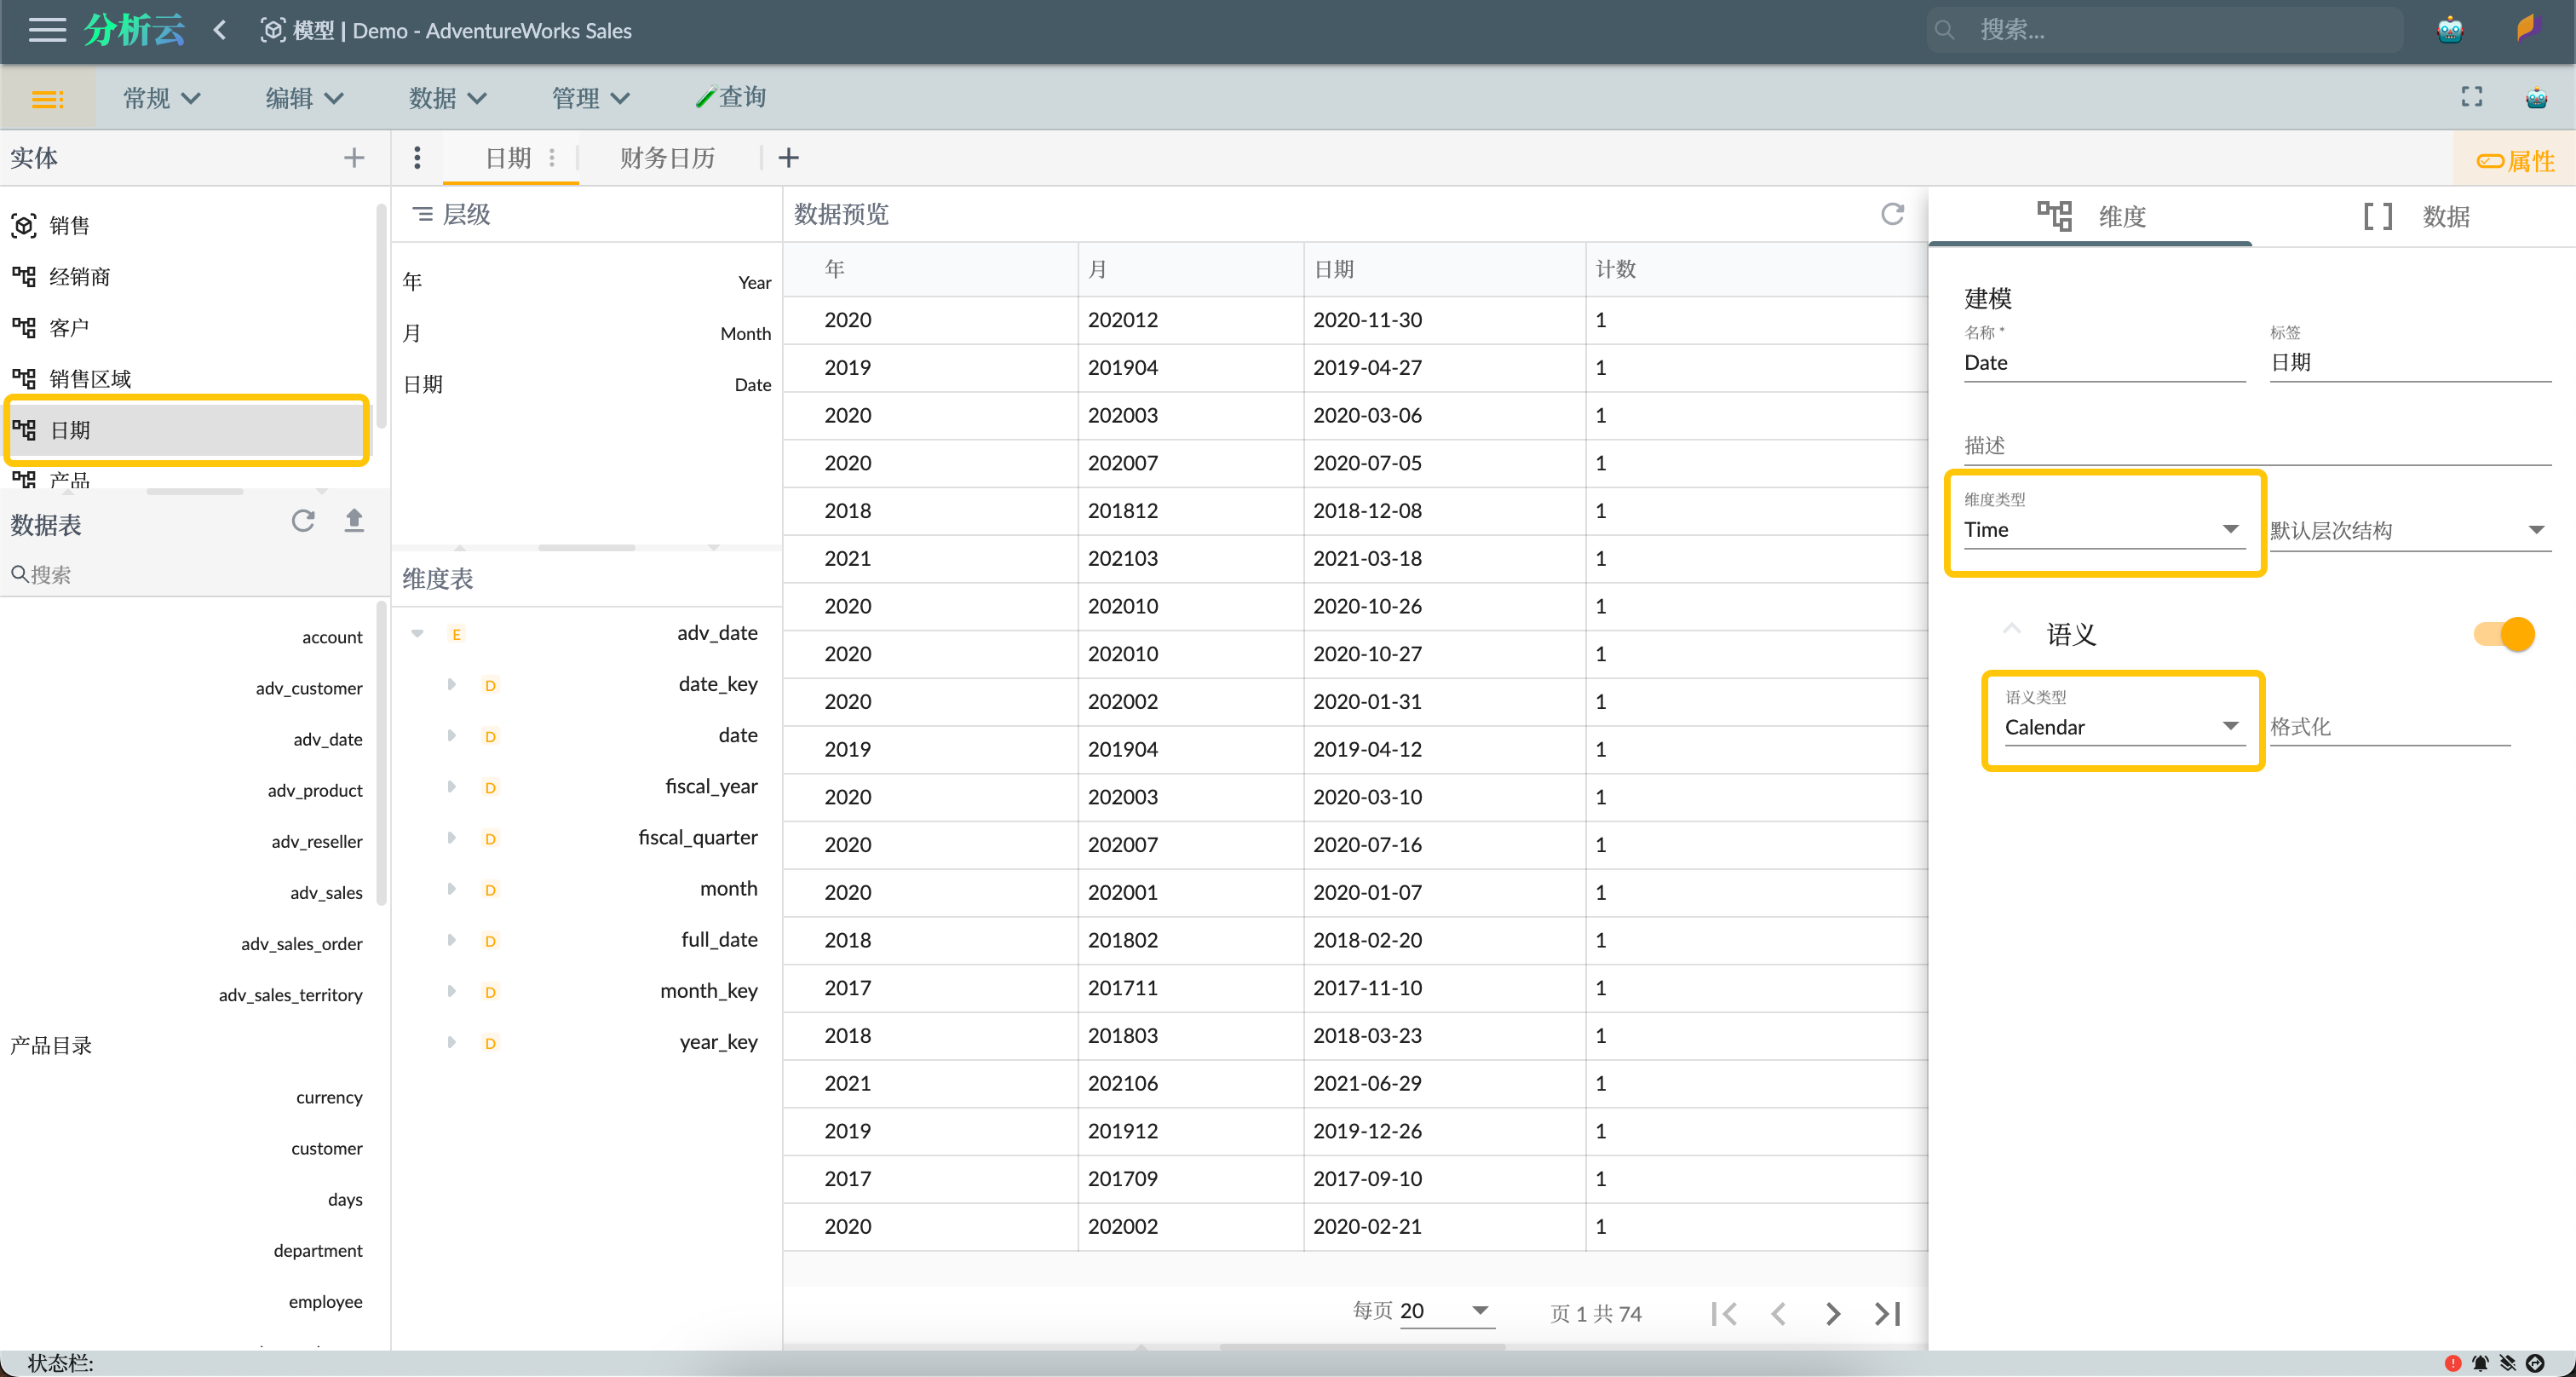
Go to the AdventureWorks Sales semantic model created earlier and open the Date dimension interface to edit the dimension attributes:
- Set the dimension type to Time
- Set the semantic type to Calendar
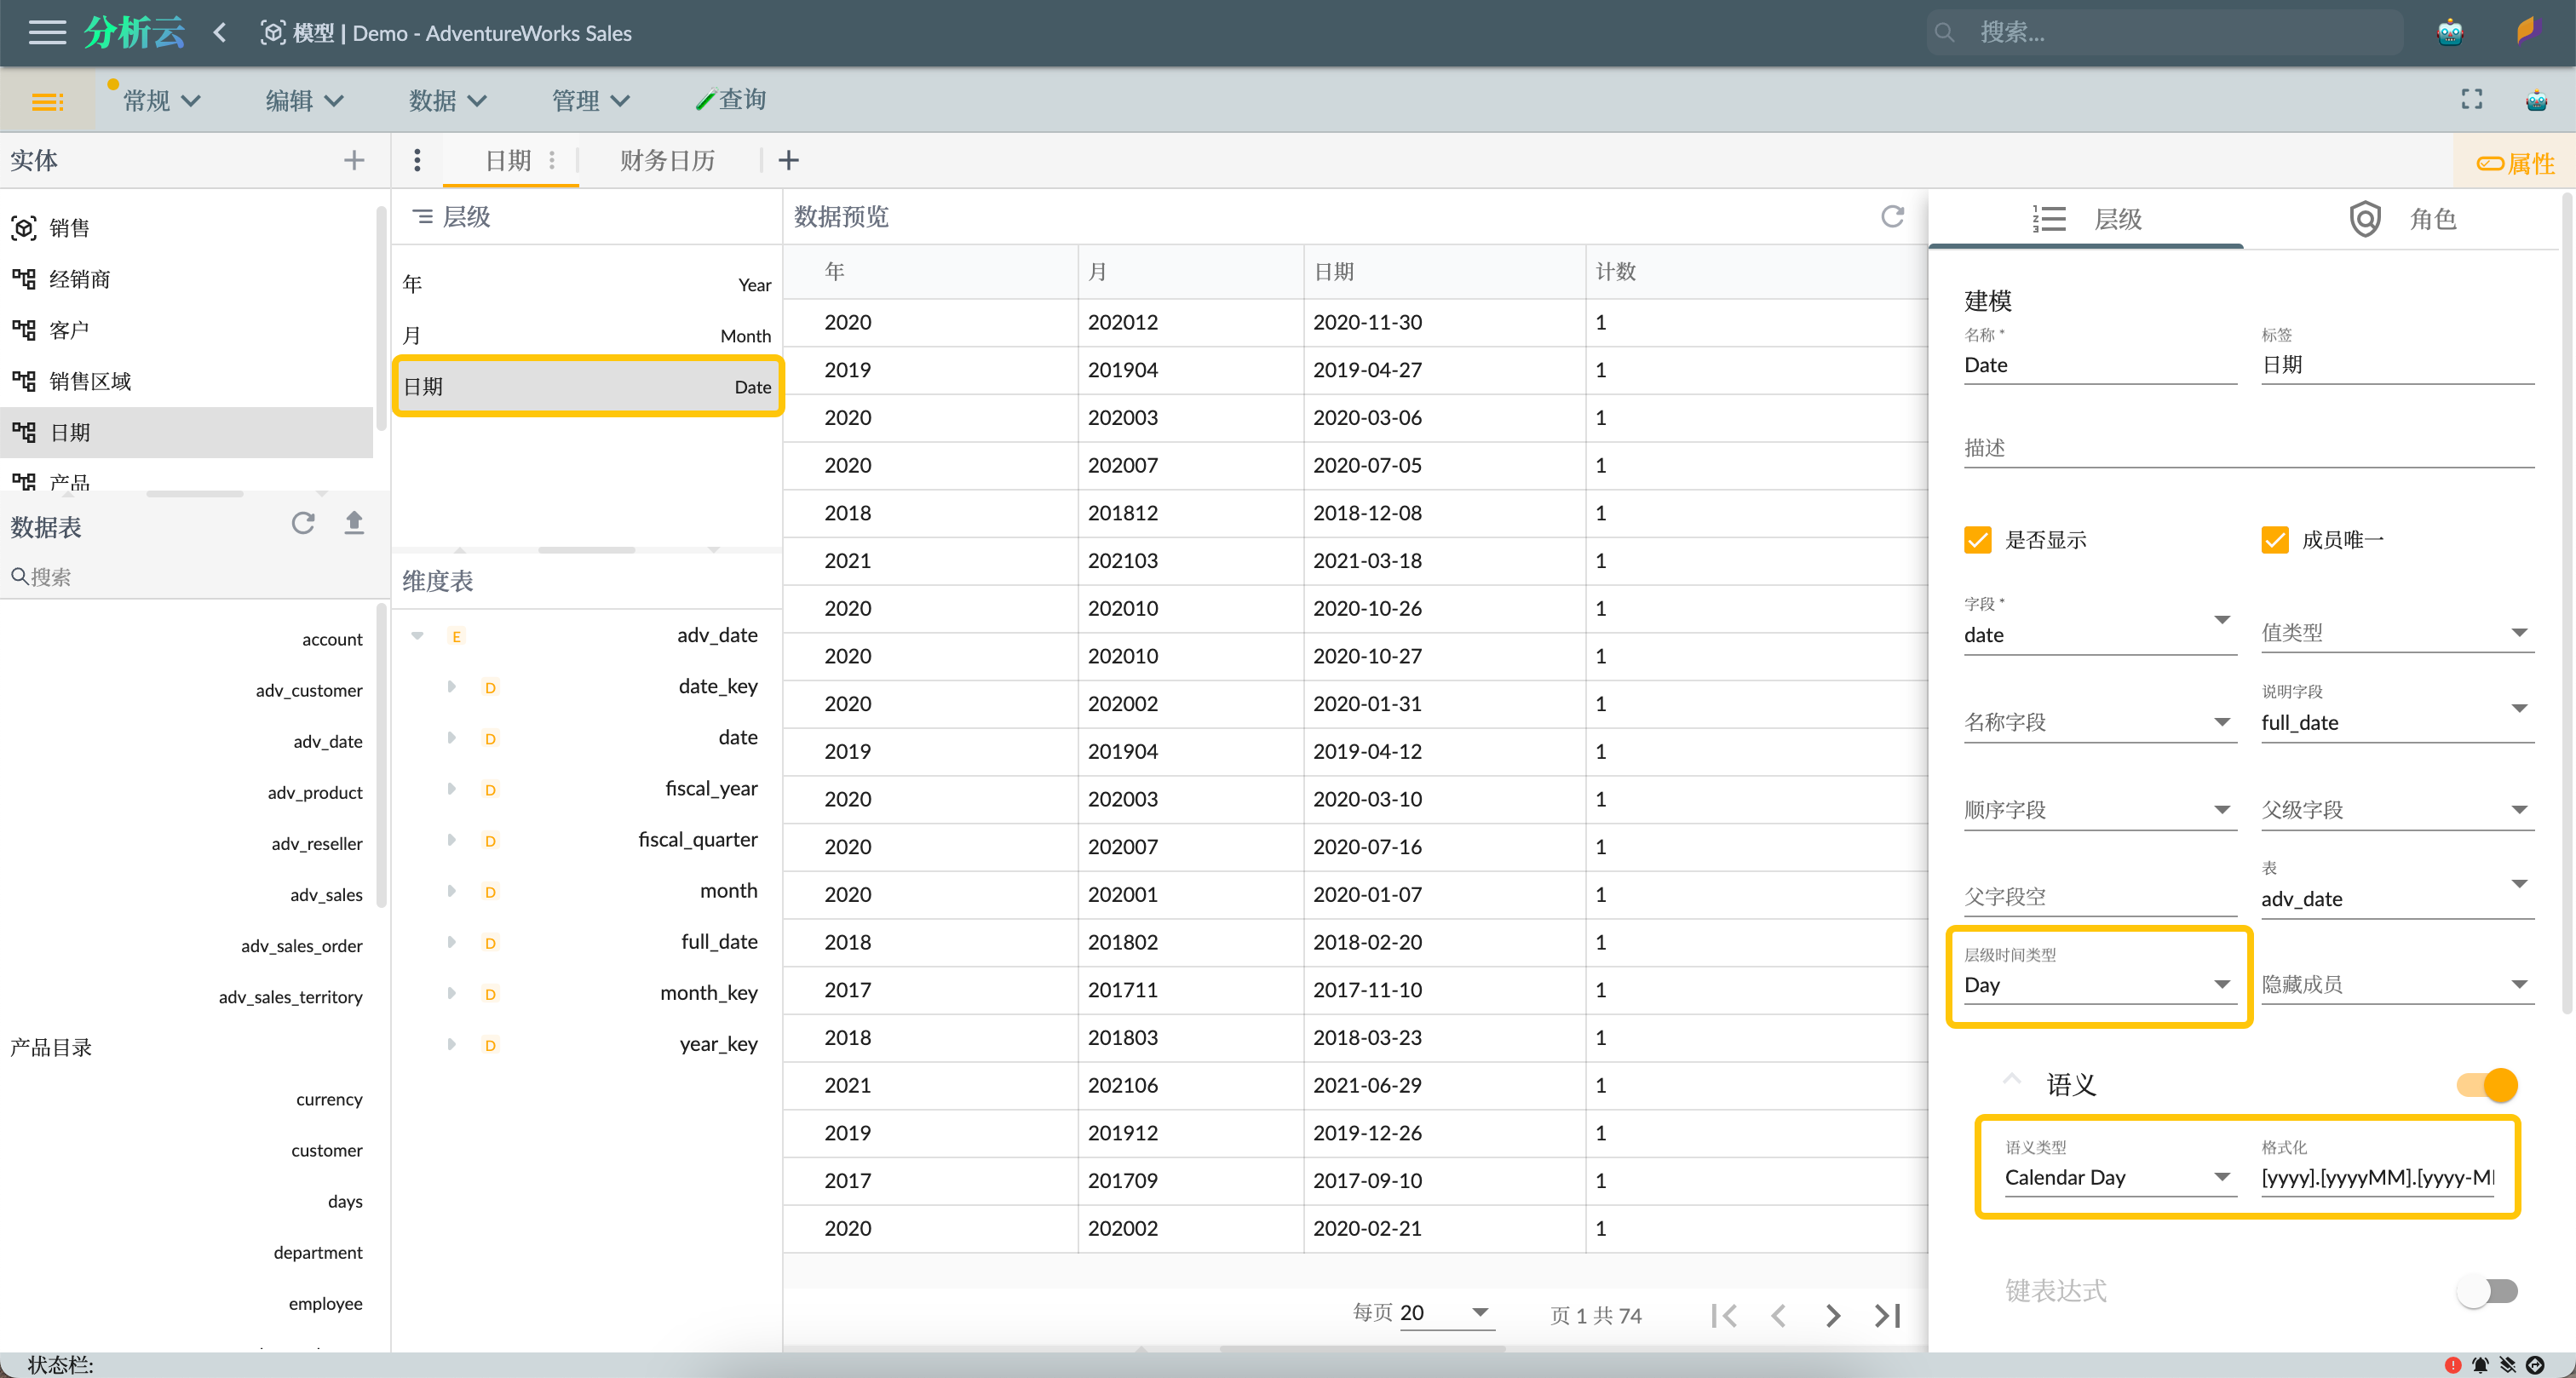
You should also set time-related properties for the levels of all hierarchies under the time dimension:
- The level time type is one of Year, Quarter, Month, Week, Day
- Semantic type is one of Calendar Year, Calendar Quarter, Calendar Month, Calendar Week, Calendar Day
- Semantic formatting
[yyyy],[yyyy].[yyyyMM],[yyyy].[yyyyMM].[yyyy-MM-dd]similar format string, according to the format of the actual member key value
For more details about time dimensions, please refer to 📆Calendar Dimension。
Register Indicator
Go to the indicator management page of the project, click the Register button, open the indicator registration page, and enter the basic information of the indicator, as shown in the following figure:
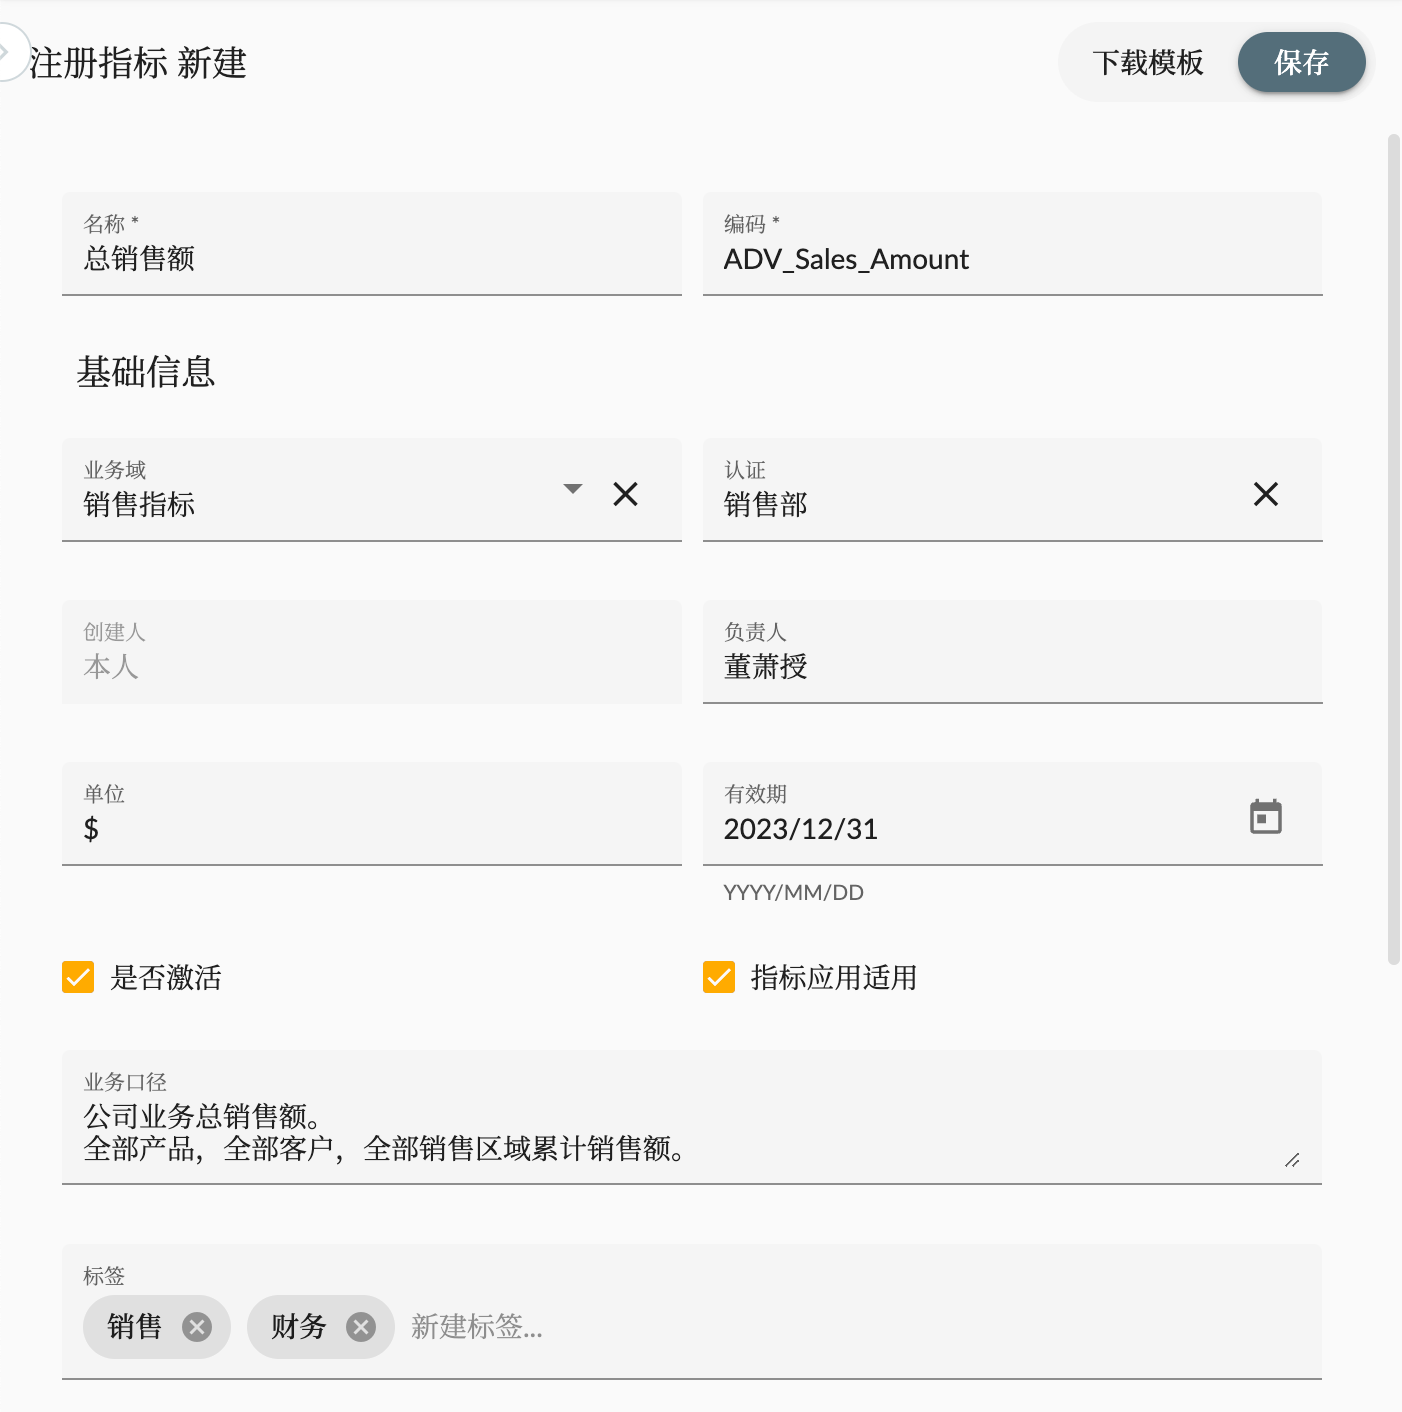
- Indicator code: The unique identifier of the indicator, used to uniquely identify the indicator in the system. The coding rules are determined by the user, but it is necessary to ensure that they are unique within the organization.
- Indicator name: The name of the indicator is used to display the name of the indicator in the system.
- Certification: It is a process in which the data quality of an organization is professionally recognized.
For more information about indicators, please refer to 💹Indicator Management.
Model Info
After defining the basic information of the indicator, you need to define the model information of the indicator. As shown in the figure below, select the semantic model and then select the model entity:
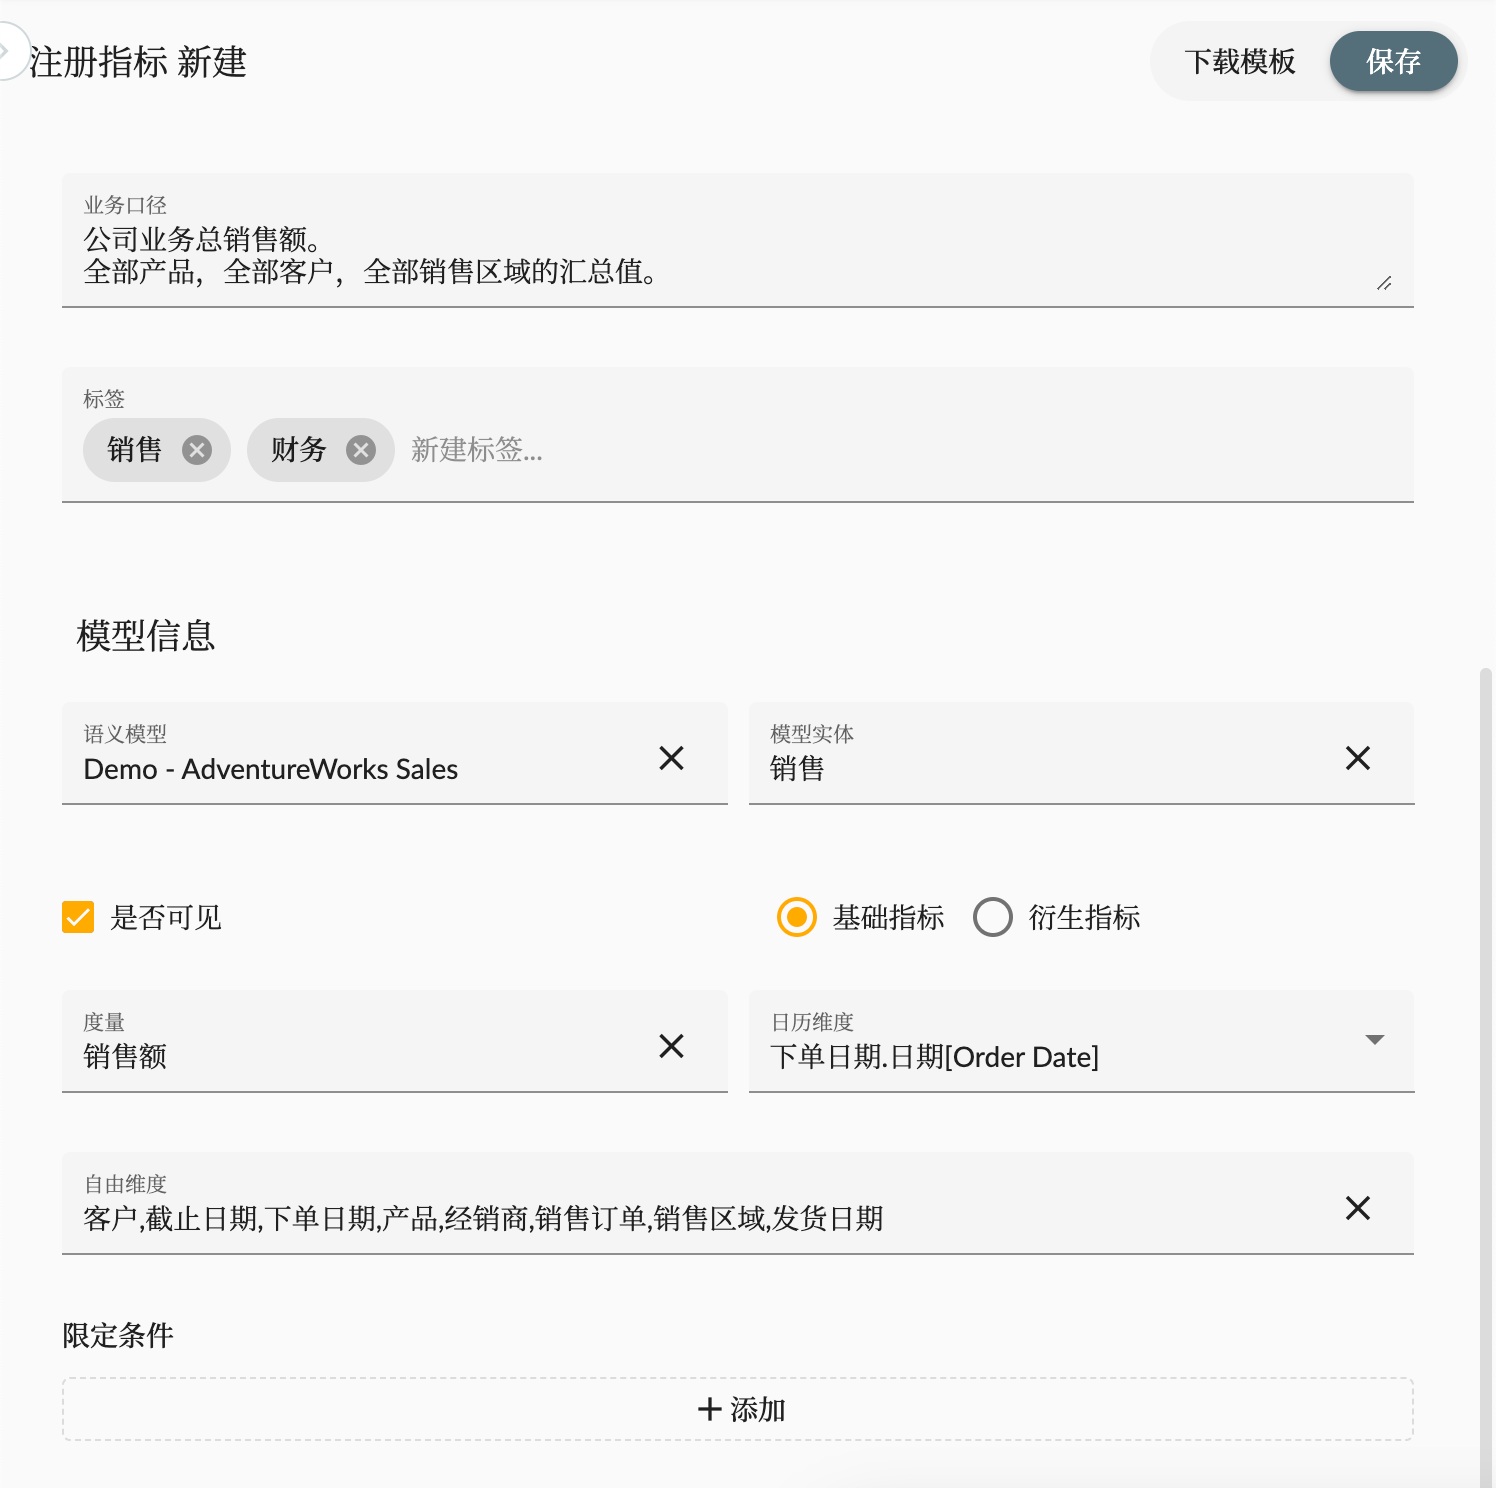
- Visible: Whether the indicator is visible. If not, the user will not be able to see the indicator in the analysis tool.
- Type
- Base: The indicator is a base indicator, and the measurement value of the indicator will be selected directly from the measurement of the model entity.
- Derived: The indicator is a derived indicator, and the measurement value of the indicator will be obtained by formula calculation.
- Measurement: The measurement field of the base indicator
- Calendar dimension: The calendar dimension of the indicator, used for time analysis of the indicator, including trend, year-on-year, etc.
- Free dimension: The free dimension of the indicator, which is not limited in the model entity. It is used for indicator analysis, including dimension slicing, dimension drilling, etc.
- Limit condition: The limited condition of the indicator, limiting the data scope of the indicator.
Restrictive conditions
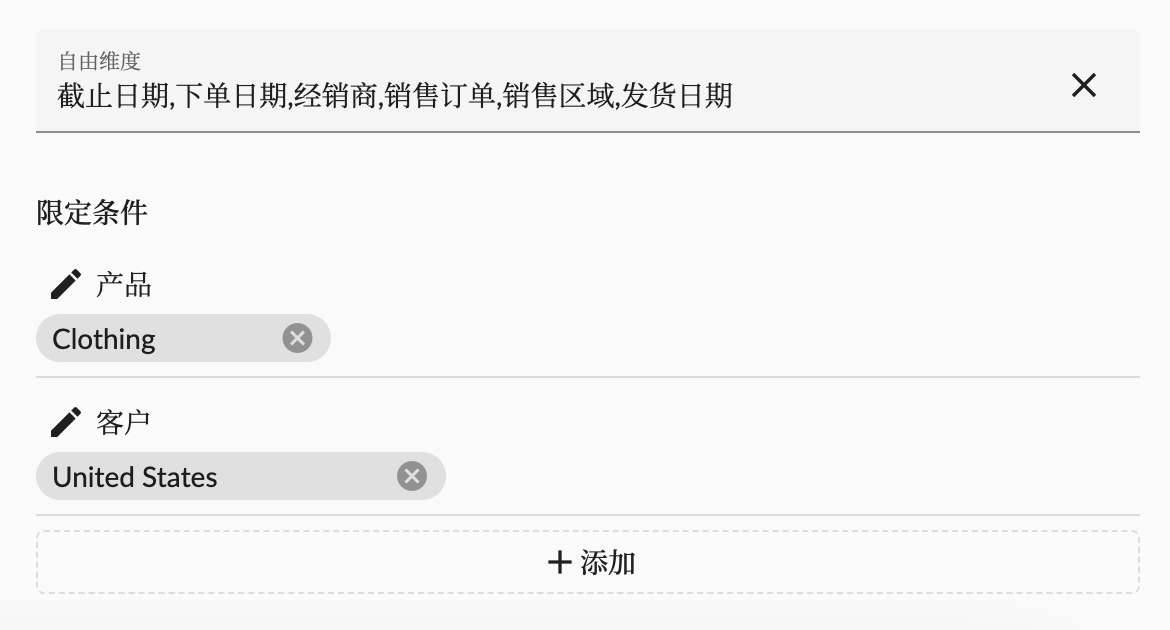
🔪Restrictive conditions By slicing, slicing and combining the slices of the multidimensional data set to reduce the number of dimensions of the data set and reduce the complexity of the data analysis. The indicator definition is refined by adding restrictive conditions to reduce the number of free dimensions of the indicator, thereby reducing the complexity of the indicator analysis.
As shown in the figure below, the definition of the indicator is refined by adding two restrictive conditions of Customer and Product, and the number of free dimensions of the indicator is reduced by reducing the number of free dimensions of the indicator:
Derivative Indicator
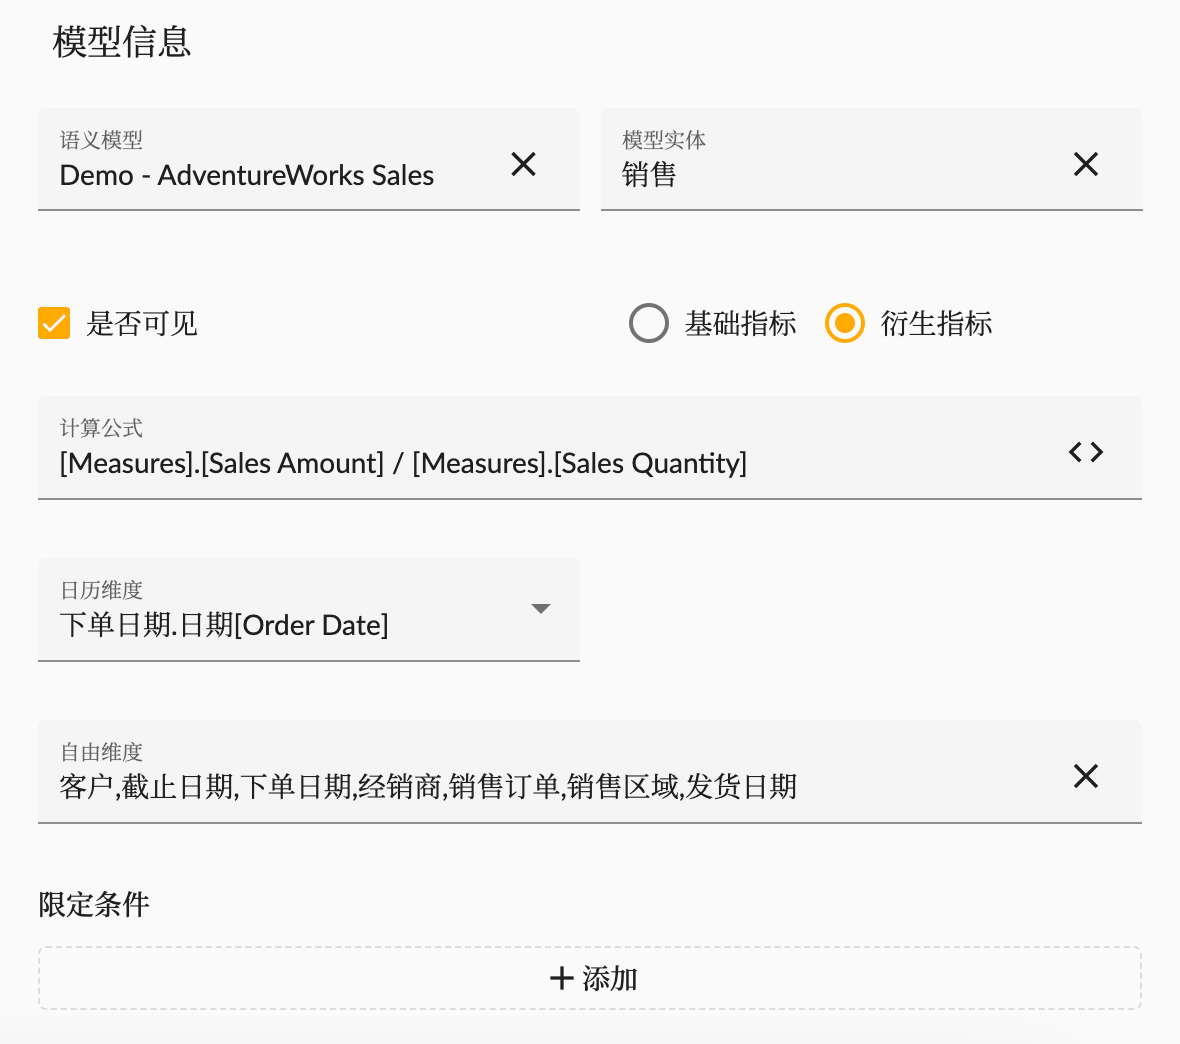
💹Derivative indicators are indicators derived from the calculated values of the original metrics. So when registering indicators, you need to set the type of derivative indicators and define the calculation formula. As shown in the figure below,
We define a derivative indicator Average Sales Unit Price, whose calculation formula is [Measures].[Sales Amount] / [Measures].[Sales Quantity], which is the average value of sales amount divided by sales quantity:
Appendix
The following are all the indicators data
| Business area | Indicator name | Indicator code | Type | Measure or Formula | restrictive conditions |
|---|---|---|---|---|---|
| Sales Indicators | Total Sales Amount | ADV_Sales_Amount | Basic | Sales Amount | |
| Total Sales Quantity | ADV_Sales_Quantity | Basic | Sales Quantity | ||
| Total Volume | ADV_Sales_Volume | Derive | Count([Sales Order.Orders].[Sales Order].Members, EXCLUDEEMPTY) | ||
| Average Unit Price | ADV_Average_Unit_Price | Derive | [Measures].[Sales Amount] / [Measures].[Sales Quantity] | ||
| Average Sales Amount | ADV_Average_Sales_Amount | Derive | [Measures].[Sales Amount] / [Measures].[Volume] | ||
| Internet Sales Amount | ADV_Internet_Sales_Amount | Basic | Sales Amount | Channel = Internet | |
| Reseller Sales Amount | ADV_Reseller_Sales_Amount | Basic | Sales Amount | Channel = Reseller | |
| Customer Indicators | Customer Count | ADV_Customer_Count | Derive | Count([Customer].[Customer].Members, ExcludeEmpty) | |
| Customer Grand Count | ADV_Customer_Grand_Count | Derive | Count( Extract( Filter( PeriodsToDate( [Order Date].[(All)], [Order Date].CurrentMember ) * {[Customer].[Customer].Members}, NOT [Measures].[Sales Amount] is Empty ), [Customer] )) | ||
| Sales Amount per Customer | ADV_Sales_Amount_per_Customer | Derive | [Measures].[ADV_Internet_Sales_Amount] / [Measures].[Customer Count] | ||
| Customer Purchase Frequency | ADV_Customer_Purchase_Frequency | Derive | [Measures].[Sales Quantity] / [Measures].[Customer Count] | ||
| Product Indicators | Clothing Sales Quantity | ADV_Sales_Quantity_Clothing | Basic | Sales Quantity | Product = Clothing |
| Bikes Sales Quantity | ADV_Sales_Quantity_Bikes | Basic | Sales Quantity | Product = Bikes | |
| Clothing Sales Percentage | ADV_Sales_Percentage_Clothing | Derive | ([Product.Products].CurrentMember, [Measures].[Sales Amount]) / ([Product.Products].[All Product.Productss], [Measures].[Sales Amount]) | Product = Clothing | |
| Clothing Sales Growth Rate | ADV_Sales_Growth_Rate_Clothing | Derive | ([Measures].[Sales Amount] - CoalesceEmpty((Measures.[Sales Amount], [Order Date].PrevMember), Measures.[Sales Amount])) / CoalesceEmpty((Measures.[Sales Amount], [Order Date].PrevMember), Measures.[Sales Amount]) | Product = Clothing | |
| Area Indicators | North America Sales Amount | ADV_Sales_Amount_North_America | Basic | Sales Amount | Sales Territory = North America |
| Reseller Indicators | Reseller Count | ADV_Reseller_Count | Derive | Count([Reseller].[Reseller].Members, ExcludeEmpty) | |
| Sales Amount per Reseller | ADV_Sales_Amount_per_Reseller | Derive | [Measures].[ADV_Reseller_Sales_Amount] / [Measures].[ADV_Reseller_Count] |